How to use Druva Network Performance Tool
Overview
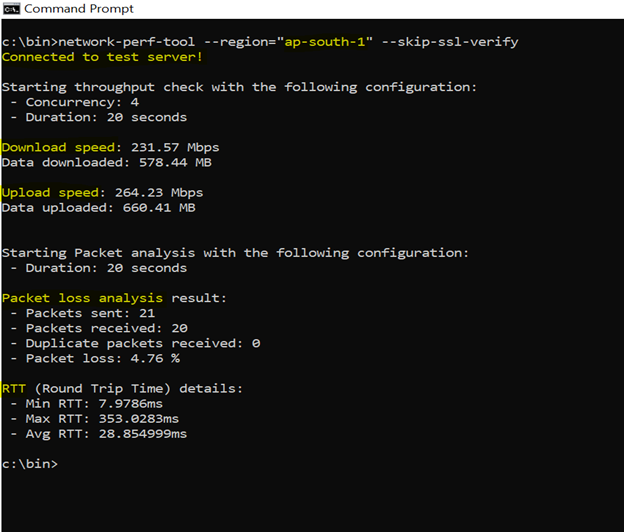
This utility is crafted to assist in identifying network issues by assessing the connectivity of customer devices to AWS regions, offering insights into bandwidth, packet loss, and latency. The tool encompasses the following features:
- Compatibility with both Linux and Windows operating systems.
- Capabilities to conduct network evaluations against specific AWS regions, including:
- us-east-1
- us-west-2
- eu-central-1
- eu-west-1
- eu-west-2
- eu-west-3
- eu-north-1
- ap-south-1
- ap-southeast-1
- ap-southeast-2
- ap-northeast-1
- Measurement of upload and download throughput.
- Customization options for packet size, duration, and concurrency during tests.
- Selective skipping of specific checks for focused analysis.
- Evaluation of packet loss and round-trip time against servers hosted in a designated region.
- Web proxy support.
Installation Instructions
Unzip the file provided by Druva Support to your preferred location.
Note: Place the binary under antivirus exclusion to prevent interference by antivirus software.
Usage Commands
- How to run this tool against a specific region?
network-perf-tool --region="<aws_region>" - How to run this tool for a specific workload?
network-perf-tool --region="<aws_region>"--workload=<workload> - How to modify the block size?
network-perf-tool --region="<aws_region>" --block-size= <new_block_size_in_bytes> - How to modify the number of concurrent connections?
network-perf-tool --region="<aws_region>" --concurrency=<new_concurrency> - How to modify the duration of the check?
network-perf-tool --region="<aws_region>" --duration=<new_duration_in_seconds> - How can I provide the network proxy details?
network-perf-tool --region="<aws_region>" --proxy-help - How can I skip any specific check?
As of today, there are 3 such flags provided to skip uplink, downlink, and packet loss check. These options are --skip-uplink, --skip-downlink and --skip-packet-loss respectively. - How can I know what all options are available?
network-perf-tool --help
FAQs:
- Where can I find logs to figure out if anything goes wrong?
Logs will be placed at the same location from where the tool is executed. The log file name is network-perf-tool.log - What is the default block size used by the tool?
1 MB - What is the default duration for each check?
20 seconds - What is the default number of concurrent network connections used by the tool?
4 - What is the max block size allowed?
16 MB - What is the max duration allowed to run each check?
120 seconds - What is the max number of concurrent network connections allowed by the tool?
128