Druva inSync - FireEye Helix Integration
Overview
It is critical to monitor actions or events happening in your organization so that you can protect data and improve your incident response time in case of events like ransomware, data theft, and insider attacks.
While Druva inSync provides you with reports, alerts, and audit trails to monitor activities in the Druva inSync Management Console, you need a platform that enables you to monitor and detect abnormal activities proactively for timely action.
You can now integrate Druva inSync with FireEye Helix and get visibility into activities and actions with the capability to monitor, analyze, detect, and respond to data breaches. Druva provides FireEye Helix customers with an in-built app that communicates with the Druva Events API for consuming and monitoring the events.
Customers can take benefit of in-built Rule Packs to define alerts and monitor events using out of the box or custom Dashboards.
Administrators can monitor the following events using Druva inSync - FireEye Helix integration and keep the threats at bay by -
- Identifying abnormal data restoration, ensuring data being restored is within the enterprises’ network
- Ensuring compliance to geography-based data access and restoration policy
- Offering visibility into who is accessing the system, tracking Unauthorized Admin Login attempts, password changes, and Admin attempts to download or recover data
- Creating alerts, generated by using pre-built rules, which trigger pre-configured playbooks to help security analysts to assess the event and take appropriate mitigation actions rapidly
This document lists the steps to integrate Druva inSync with FireEye Helix and monitor the events for any abnormal events in FireEye Helix.
Pre-requisites
- You must be a Druva Cloud Administrator to carry out the actions in the Druva Management Console.
- You must have an account with sufficient rights to carry out actions listed in this document in the FireEye Helix Connect Console.
Step 1 - Enable Druva inSync Events API
- Contact Druva Support to enable the Events API feature.
- Enable the option to export events from the inSync Management Console.
- On the inSync Management Console menu bar, click
 > inSync Settings. The Settings page appears.
 - Click inSync APIs tab.
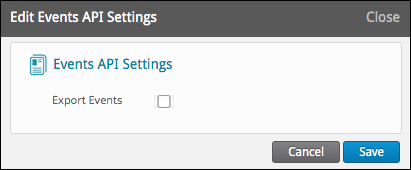
- In the Events API settings area, click Edit. The Edit Events API Settings window appears.
- Select the Export Events check box.
- On the inSync Management Console menu bar, click
- Configure the events that can be exported using the Events API.
- Click in the Categories to export box and select the events that you want to export from inSync. For more information about inSync events that you can export, see Supported inSync events.
- In the Syslog facility field, type a value between 1 and 23 to assign a Syslog facility ID for inSync events. The default value is 23.
- Click in the Categories to export box and select the events that you want to export from inSync. For more information about inSync events that you can export, see Supported inSync events.
- Click Save.
Step 2 - Generate API Credentials
The API credentials are a combination of the Client ID and Secret Key and is equivalent to that of a user name and password.
Client ID and Secret Key are equivalent to user name and password. One can access all the Druva APIs and in turn, access your data stored within Druva products. Client ID and Secret Key must not be shared with unauthorized sources.
To generate new API Credentials,
- In the Druva Management Console, click the Druva logo
 > Druva Cloud Settings.
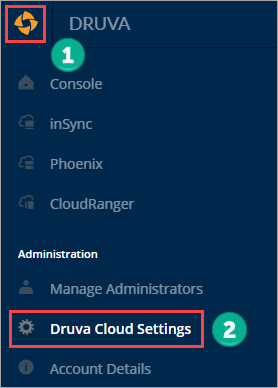
- On the Settings page, click API Credentials.
You see the following page when you access the API Credentials.
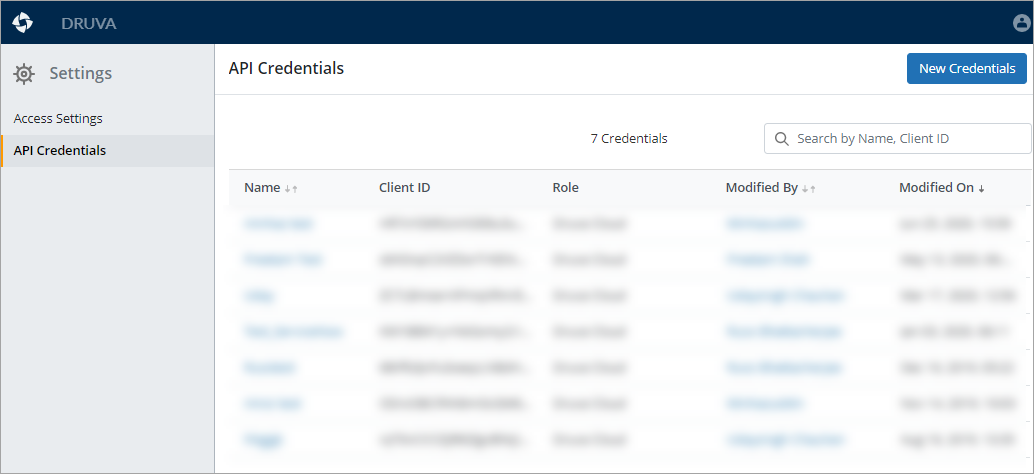
- Click New Credentials. The New Credentials window appears.
- Provide a name for the credential.
For ease of recognizing the credential name, it is recommended to name the credential so that it matches the name of the application or tool that you intend to integrate with Druva products.
- To apply network restrictions, perform the steps provided in Apply network restrictions.
- To apply authorization restrictions, perform the steps provided in Apply authorization restrictions.
- Click Save. The Credential Details window appears.
- Click the
 icon to copy the auto-generated Client ID and Secret Key to the clipboard.
- You need to generate a new Secret Key for the associated credential if you do not copy the Secret Key as per step 3.
- API usage and activities can be tracked through audit trails. The audit trails display the API credential details, target APIs, and user details along with the time of usage.
Step 3 - Install Druva App in Helix Connect Portal
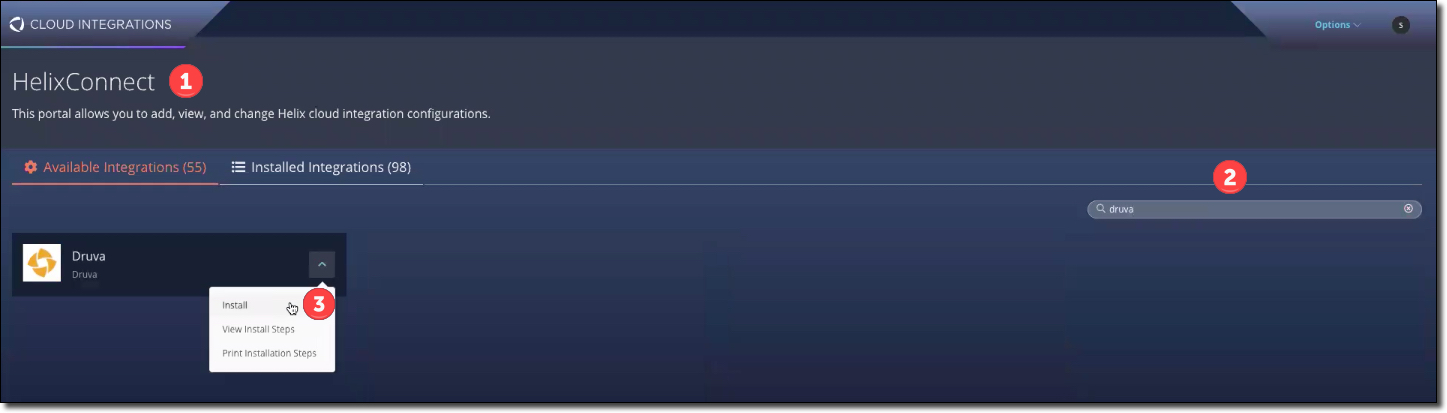
- Login to Helix Connect Portal.
- Under the Available Integrations tab, search for the Druva app.
- Select the Druva app and from the drop-down menu, select and click Install.
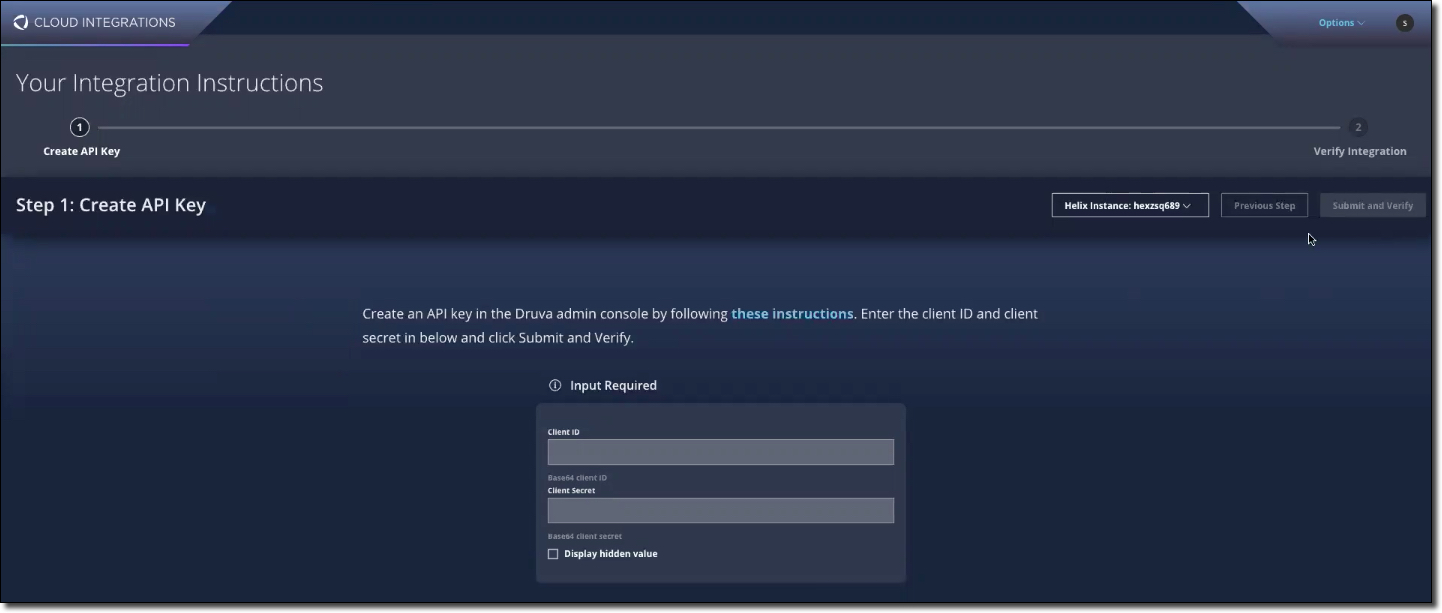
- On the Create API Key page, enter the API Credentials, that is, Client ID and Secret Key (that you created in Step 2). Helix Connect Portal verifies the credentials.
After Druva App is successfully verified, it starts fetching the events from the inSync Management Console using the Events API. You can view the events in the Parser.
Druva App also comes with in-built Rule Packs and three standard Dashboards.
- Rule Packs identify the events based on their type and generate alerts for administrators.
- Dashboards are useful for listing and monitoring the events based on their alert type and help administrators take the required action based on their findings.
Step 4 - View events
View Druva inSync events in Parser
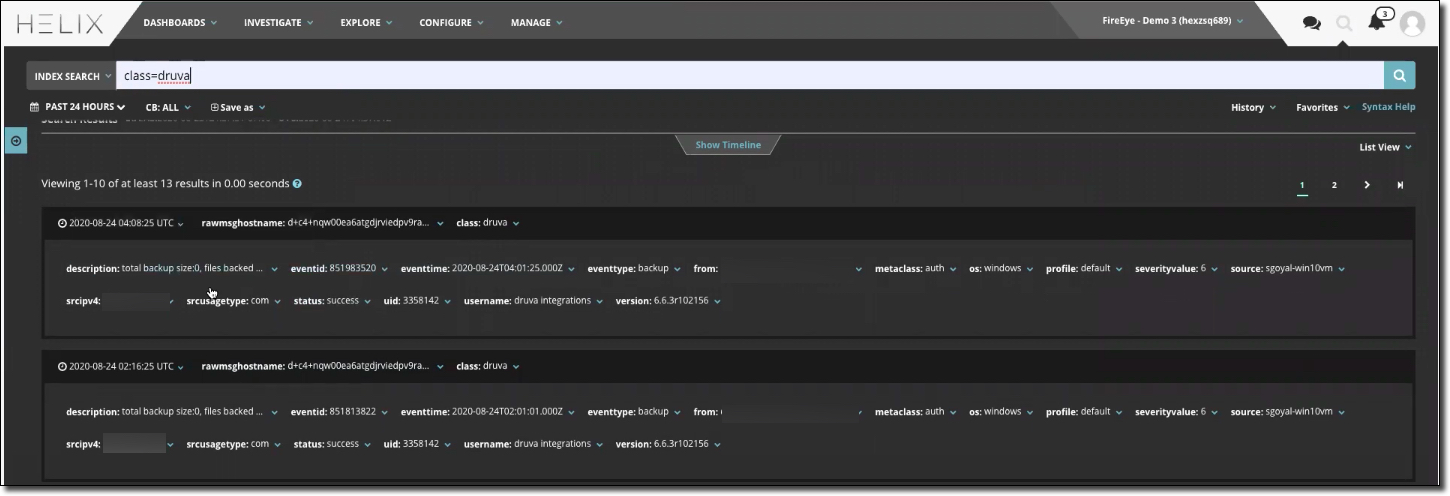
Parser displays the events fetched from Druva inSync Management Console in JSON format. This view helps you in understanding and reading the events in the format as received from Druva.
To view events in the Parser,
- On the Helix Console, click the Find icon.
- In the Index Search box, type class=druva.
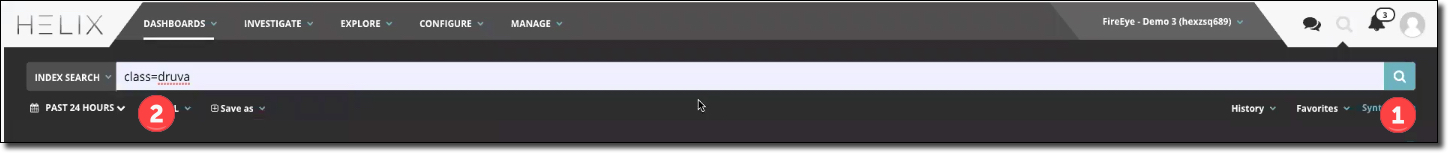
- The Parser loads the events fetched from the Druva inSync Management Console.
View Rule Packs
Druva app comes with pre-defined Rule Packs that generate alerts. Administrators can take actions based on these alerts.
- On the Helix Console menu bar, click Configure > Rules.
- Click the Rule Pack column and filter it by selecting Vendor-Druva from the list of available Rule Packs.

All the pre-built Rule Packs are displayed.
View Dashboards
Druva app comes with three built-in Dashboards that are useful for listing and monitoring the events based on their alert type and help administrators take the required action based on their findings.
- Druva Security Dashboard - Displays statistics for alerts generated for events related to AD sync, Admin login failed events, and alerts based on severity.
- Druva Operational Dashboard - Displays statistics for alerts generated for events related to backup failures, profile type, and device OS.
- Druva Users Dashboard - Displays statistics for alerts generated for events related to the total number of backup activity failed, the total number of successful and failed restore activities for users
To view a dashboard,
- On the Helix Console menu bar, click Dashboard > Custom.
- Filter the list of custom dashboards by clicking on the Title column. Search for 'Druva' to list the dashboards.
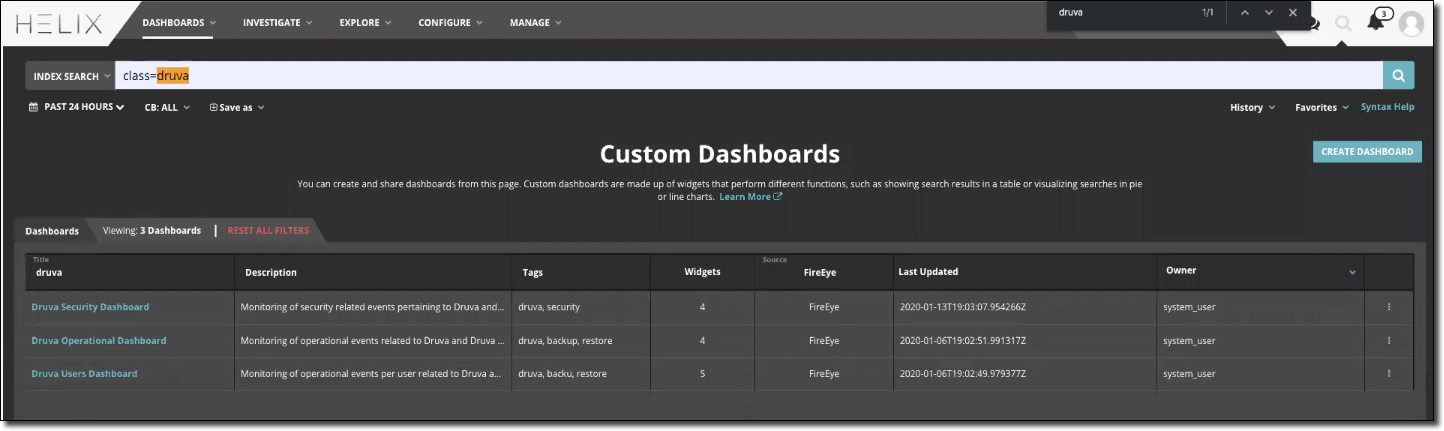
- Click on the Dashboard to view the statistics for the alerts generated.
You can also create your custom dashboard to build your own view and select the events that you want to monitor.