Druva app for Splunk
Overview
Splunk is a widely used SIEM tool by customers to monitor logging for threats and risks from different applications centrally.
Druva has two apps published in the Splunk market today:
- Druva App for Splunk
- Druva Add-on for Splunk
Druva App for Splunk
This app provides the following:
- An Operational Overview and Security Overview dashboard which you can use to get an overview of events, graphs, or telemetry
- Capability to search for backup, restore, login, or unusual data activity (UDA) events
Druva Add-on for Splunk
This is a configuration app that helps with the following:
- Add a tenant
- Provide the API credentials generated from your Druva tenant
- Provide indexing details
Note: Both apps must be installed to start using the dashboard.
Supported Workload events
Below is a list of different events captured and displayed on the Splunk App:
Endpoints and SaaS Apps events
-
Backup failure, success, interrupted
-
Restore failure, success, interrupted
-
Files missed from backup and restore
-
All types of alerts, notifications, and admin audit trails
-
Admin Login
-
WebDav admin login
-
Unusual Data Activity
-
AD Sync
-
Data Source
-
Client Upgrade
-
Device Replace
-
Additional Data Collection
-
User Event
VMware events
-
Backup Failure
-
Backup success
-
Restore Failure
-
Restore Success
Note: To view the Security Events (Unusual Data Activity), you must have a Security Posture and Observability license.
Operational Overview dashboard
You are displayed with the following 2 tabs:
-
Endpoints and SaaS Apps
-
Enterprise Workloads
Endpoints and SaaS Apps tab
Backup or IT administrators can use this dashboard to:
Monitor the deployment health
You can filter the data display using the Time filter. It allows you to filter data based on Real-time, Relative, and so on. Select an option as per your requirement.
- Unique number of users: View the unique number of users for Endpoints and SaaS Apps
- Unique number of devices: View the unique number of Endpoint devices
- Unique number of SaaS Apps devices: View the unique number of Exchange Online, OneDrive, Gmail, and Google Drive devices
- Top 15 Users by number of devices: View the top 15 users by device count
- Top 15 Users by number of SaaS Apps: View the top 15 users by SaaS Apps device count
- Devices/Apps Added over time: Get a graphical summary of devices added over a period that provides information about:
- If Druva app is successfully deployed on all user devices
- If the data is protected for all users
- If there is a backup of additional devices for users
- Details of users consuming maximum storage
- Details of the deployment rate and the performance of the device addition process
- Event Details: View the backup and restore event details such as:
- Event ID
- Event Type
- Event State
- Ip address
- Profile Name
- Event Details
- Client OS (Only for Endpoints)
- ClientVersion (Only for Endpoints)
- Workload Name
- Event Description
- Event Creation Date
- Event Details
Use the Event Type filter to search and view details specific to backup, restore, and so on. For more information, see Supported Workload Events.
Monitor the backup failure trend
- Backup failure trend by operating system(OS): View backup failure trend by the operating system platform. It helps you understand if there is a failure pattern with a specific operating system that can be used for further analysis and resolution
Hybrid Workloads tab
Backup or IT administrators can use this dashboard to:
Monitor the deployment health
You can filter the data display using the Time filter. It allows you to filter data based on Real-time, Relative, and so on. Select an option as per your requirement.
- Unique number of VMware Backupsets: View the unique number of VMware backupsets for the selected period.
- Top 10 Admins by Restore Activity: View the top 10 administrators based on the number of restore activities initiated.
- Event Details: View the backup and restore event details such as:
- Resource ID
- Event Type
- Workload Name
- Event Description
- Event Creation Date
- Event Details
Use the Event Type filter to search and view details specific to backup or restore. For more information, see Supported Workload Events.
Monitor the backup failure trend
- Backup failure trend: View backup failure trend for each month. It helps you understand if there is a failure pattern in a specific month that can be used for further analysis and resolution
Security Overview dashboard
Security administrators can use this dashboard to:
Monitor anomalous backup activity or threats
- Unusual Data Activity alerts
- Get a view of all the Unusual Data Activity alerts generated with their timestamp that helps you with an ongoing security incident investigation
- Get a view of alert distribution based on the severity - Critical and Warning. Critical alerts help get a better understanding of the security incident
- Failed login events: Get a view of failed administrator login and WebDav login events at a specific date and time. Multiple failed login events indicate a threat. You can block these unauthorized access actions by deleting the administrator account from Druva console. In case of a genuine loss of credentials for a particular administrator, you can restore access with a password reset
Monitor anomalous restore activities-data exfiltration
- Top 15 Users by Restore Activity: View the top 15 users performing restores. Multiple restore events indicate a threat. You can disable the user or device to block unauthorized restores
Installing and Configuring the Druva Splunk App
Perform the following steps to install and configure Druva Splunk App.
Installation
-
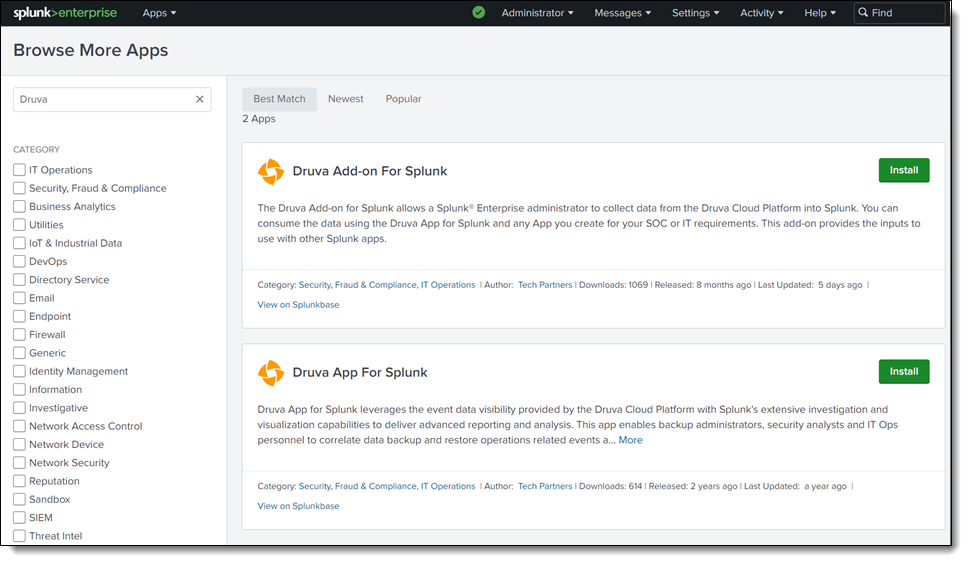
Login to the Splunk Console and navigate to Apps > Browse More Apps

-
In the Browse More Apps search box, type the keyword Druva and click Enter. Two Druva Splunk Apps are displayed.
-
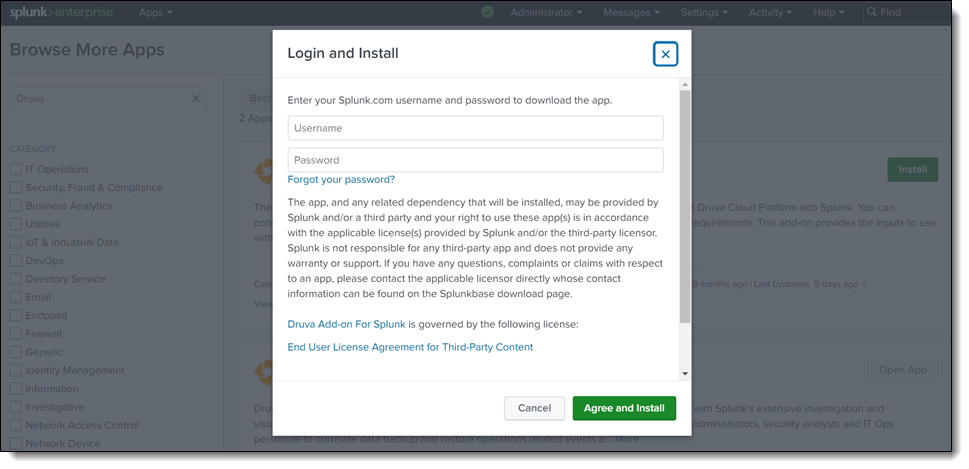
Click Install on each app one by one. Log in with your Splunk Console admin credentials to install each app.
-
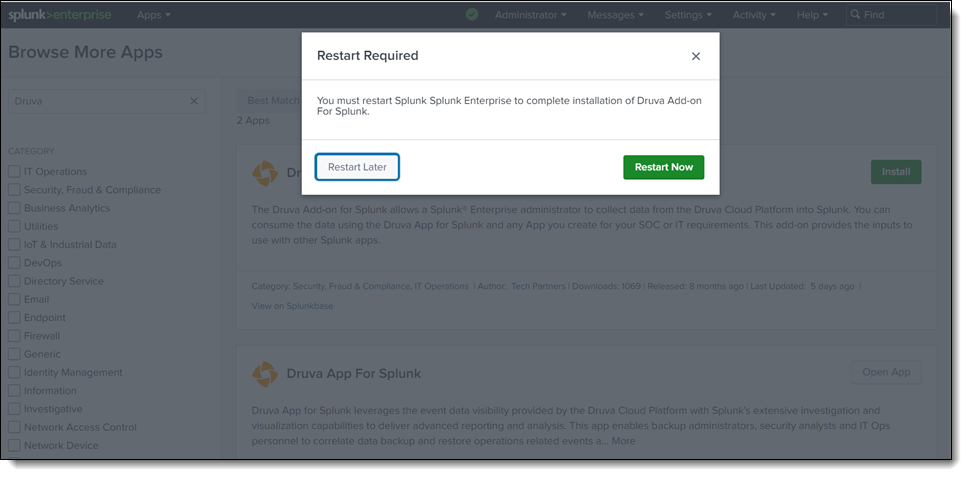
On the on-prem Splunk setup, click Restart Now to restart the Splunk services and then follow the installation instructions on the UI to complete the installation.
Configuration
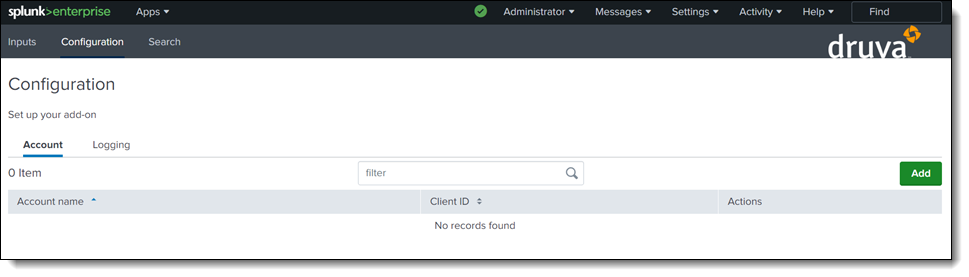
- Post successful installation, click Druva Add-on for Splunk App in the left pane on Splunk console. You must configure two accounts in the Druva Add-on App for Splunk. First account is for integrating inSync Events and the second is for integrating Unusual Data Activity Events.
- Click Add. Select Anomaly Detection > inSync Events.
-
From the DCP dashboard left navigation bar > Druva Cloud Settings page generate the API Client ID and Secret Key. Copy the Client ID and Secret Key.
- Enter the Client ID and Secret Key that was copied from the Druva console.
- Click Add.
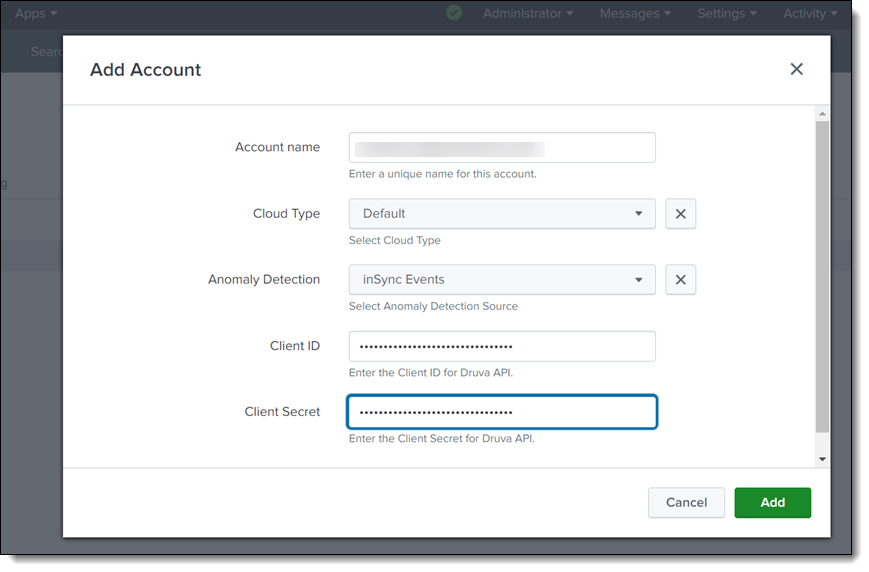
- Configure the second account. Click Add. Select Anomaly Detection > Ransomware Recovery Events.
-
From the DCP dashboard left navigation bar > Druva Cloud Settings page generate the API Client ID and Secret Key. Copy the Client ID and Secret Key.
- Enter the Client ID and Secret Key that was copied from the Druva console.
- Click Add.
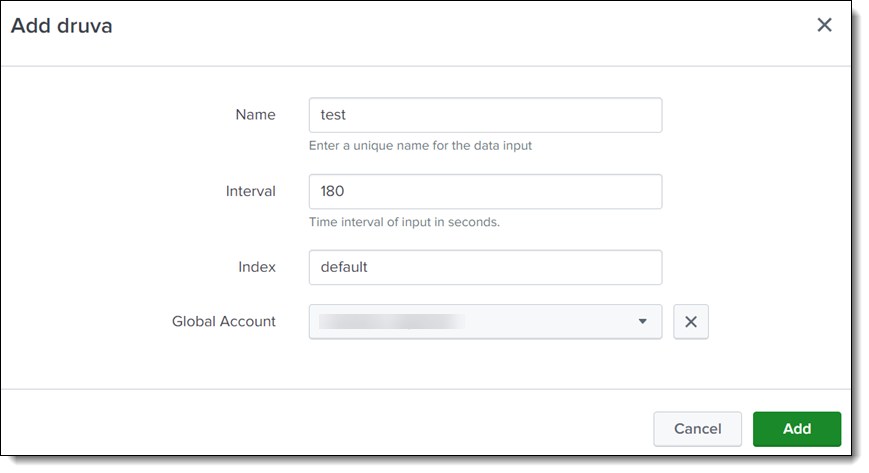
- Configure indexing details from the Inputs page. You must create two indexing inputs each for inSync Events and Ransomware Recovery Events accounts respectively. Post successful configuration, Druva Splunk App is ready for use.
- Click Druva App for Splunk to view the two dashboards: Operations Overview and Security Overview. You can also use search for backup, restore, log in, or unusual data activity (UDA) events.