Unusual Data Activity
Introduction
Suspicious data modification on a resource is called Unusual Data Activity (UDA). A user or malicious software can make such changes. For example, if a resource in your organization is under attack, the malicious software on the resource can start modifying and deleting files present in the resource. A resource is a device or server or Sharepoint site where data is stored.
- Unusual Data Activity displays insights about the data protected only for the following resources:
- Endpoints
- Microsoft 365 - OneDrive
- Microsoft 365 - SharePoint
- NAS
- File Servers (Windows/Linux)
- VMware (Windows and Linux-64-bit)
- Data is displayed for up to the last 30 days.
When such a potential threat manipulates the data on a resource, it is suspicious in nature and is unlike how the resource owner works with data on that resource. Since anomalies of this type often indicate issues that require attention, Druva flags any such anomalous behavior in a resource and generates an alert.
Prerequisites for VMware UDA
If you are using UDA for virtual machines, ensure that the following prerequisites are met:
- VMware tools are installed and enabled on the virtual machine. For more information, see Install and Upgrade VMware tools.
- Keep the Guest OS credentials handy as you need to provide these details
- For Windows virtual machines: The user credentials provided must have administrator privileges or access rights
- For Linux virtual machines: The user credentials provided must have either root privileges or sudo user access rights. For more information about configuring and managing sudo user credentials, see Manage credentials for VMware servers.
- The proxy version must be 6.3.0_259971 and above
- For Windows virtual machines: Enable USN journal for each drive with enough storage.
The default Windows USN journal size for most Windows versions is 32 MB which is insufficient for UDA on large virtual machines. Druva recommends the following USN journal sizes for different disk sizes:
| File Count | Disk Size | Maximum Size |
|---|---|---|
| Files > 10 million | 500 GB | 2 GB |
| Files > 5 million | 200 GB | 1 GB |
| Files > 2 million | 50 GB | 512 MB |
| Files > 1 million | 10 GB | 256 MB |
To increase the USN journal manually, see Microsoft 365 documentation.
- For Linux virtual machines: The iNotify watches maximum limit value must be more than the number of directories on the virtual machine
- For Linux virtual machines: Any one of these file system types should be present on the virtual machine - ‘xfs’ , ‘ext4’, ‘ext3’
For more information about the software requirements for VMware, see the Support matrix for VMware.
- Ensure that the following URLs are whitelisted and allowed for a successful VMware UDA scan:
*s3.amazonaws.com/*
s3-*.amazonaws.com
s3*.*.amazonaws.com
For more information, see,
Support matrix for VMware UDA
The following are the supported windows versions for VMware UDA:
- Windows 10 (32 and 64-bit)
- Windows Server 2012 (64-bit)
- Windows Server 2016 (64-bit)
- Windows Server 2019 (64-bit)
The following are the supported Linux (64-bit) versions for VMware UDA:
- Red Hat Enterprise Linux (RHEL) 7.0 , 7.1, 7.2, 7.3, 7.4, 7.5
- CentOS 7.0 , 7.1, 7.2, 7.3, 7.4, 7.5
- Ubuntu 16.04, 18.04
Things to Consider
Following are a few limitations that you should know before using UDA for VMware:
Error: UDA scan fails with the following error: Invalid pid for Guest VM execution.
Description: This error is observed in the following scenarios:
- The glibc library version of the guest virtual machine is lower than 2.14
- The default SELinux restriction enforced by Red Hat. This is specifically observed for the SELinux policy version- selinux-policy-3.13.1-268.el7_9.2.noarch
Workaround: To resolve this issue, do the following:
- Upgrade the glibc library version of the guest virtual machine to 2.14 or above
- To bypass the SELinux restriction enforced by Red Hat, perform the following steps:
- Run the following command to check the SELinux status : # sestatus
- Set SELinux policy to permissive using # setenforce 0 command
- To persist enforcement policy, update selinux config file using # sudo vi /etc/sysconfig/selinux command.
For more information, see Red Hat documentation.
- UDA for VMware - Linux: A Modified alert displays an event count in case of a change made only to file permissions without any modification in the file contents. You can safely ignore those events.
- UDA for VMware -Windows: When you delete files, UDA scan cannot find file metadata from USN Journal or Windows with the given file ID. UDA scan displays the timestamp for such files as the UDA scan launch timestamp.
How does Druva detect UDA
Druva’s automated intelligence analyzes and monitors the data activity trend for a given resource, and after a sufficient sample size, it builds the anomaly baseline. An alert is automatically generated and reported in case of any anomalous activity.
What do we mean by baseline?
In the Unusual Data Activity feature context, a baseline refers to the expected pattern of data behavior over a specific period. It serves as a reference point or benchmark against which you can detect deviations or anomalies.
The following graphic provides an overview of the enhanced Unusual Data Activity:
resized.png?revision=1)
Step 1 Learning period: In this step, Druva performs a data backup pattern analysis. See Data backup pattern analysis period.
Step 2 UDA detection process: In this step, Druva performs encryption checks on the backed-up files to detect anomalous file actions such as create, update, and delete.
For VMware resources, backup and the UDA detection process run simultaneously.
Step 3: Generate and send a UDA alert: If any data anomalous activity is detected, a UDA alert is sent.
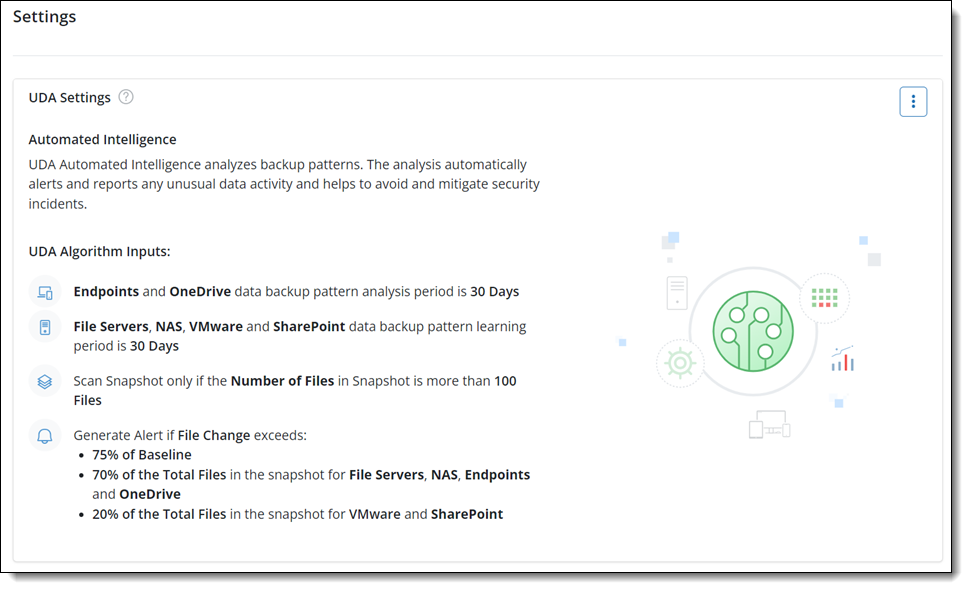
Following are the algorithm input parameters that Druva requires and uses to analyze the data activity trend and generate alerts in case of any suspicious data activity:
-
Data backup pattern analysis period for resources - Endpoints, File Server, NAS, VMware, Microsoft 365 (OneDrive and SharePoint): Displayed in Days or Snapshots
-
Number of files in a snapshot: A minimum number of files required within a snapshot to initiate UDA learning and scanning.
If the total number of files in a snapshot is less than the minimum number of files, then that snapshot is not scanned for UDA detection.
-
Deviation in the files from the baseline and total files in a snapshot: Percentage deviation threshold compared to the baseline and total files in a snapshot required to qualify as anomalous data.
Recommended UDA settings
Following are the recommended UDA settings for Druva’s analysis period to start encryption checks for a resource and generating UDA alerts.
We recommend that you keep the default - Recommended UDA Settings if you are not sure about the data backup pattern of your organization.
Data backup pattern analysis period for resources
-
30 days (For Endpoints and OneDrive): The default and recommended setting for Endpoints and OneDrive data backup pattern analysis. The UDA detection for Endpoints and OneDrive will start only if data has been successfully backed for the past 30 days. The permissible settings for days or snapshots are between 2 and 45.
-
30 days (For File Server/NAS/VMware/SharePoint): The default and recommended setting for File Server/NAS/VMware/SharePoint data backup pattern analysis. The UDA detection for File Server/NAS/VMware/SharePoint will start only if data has been successfully backed up for the past 30 days. The permissible settings for days or snapshots are between 2 and 45.
-
100 or more files in a snapshot: The default and recommended setting for the minimum required files in a snapshot of a resource to initiate UDA detection for resources - Endpoints, OneDrive, File Server, NAS, VMware, and SharePoint. The permissible setting for a minimum count of files is between 20 and 500.
-
75% of baseline in the snapshot: The default and recommended maximum setting for the file actions (Create, Update, and Delete) in a snapshot for a resource to generate a UDA alert. UDA alert is generated if the deviation is observed beyond the set baseline value. The permissible setting for baseline is between 50 and 99%.
-
% of the total files in a snapshot: The default and recommended setting for the minimum change in the count of files out of the total files in a snapshot to generate UDA alert.
Endpoints, File Server, NAS, and OneDrive: 70% of the total files in a snapshot
VMware and SharePoint: 20% of the total files in a snapshot
The permissible setting for a minimum change in the count of files is between 5 and 90% for Endpoints, File Server, NAS, and OneDrive.
The permissible setting for a minimum change in the count of files is between 5 and 90% for VMware and SharePoint.
Both the 4th and 5th conditions should be met for UDA alert to get generated.
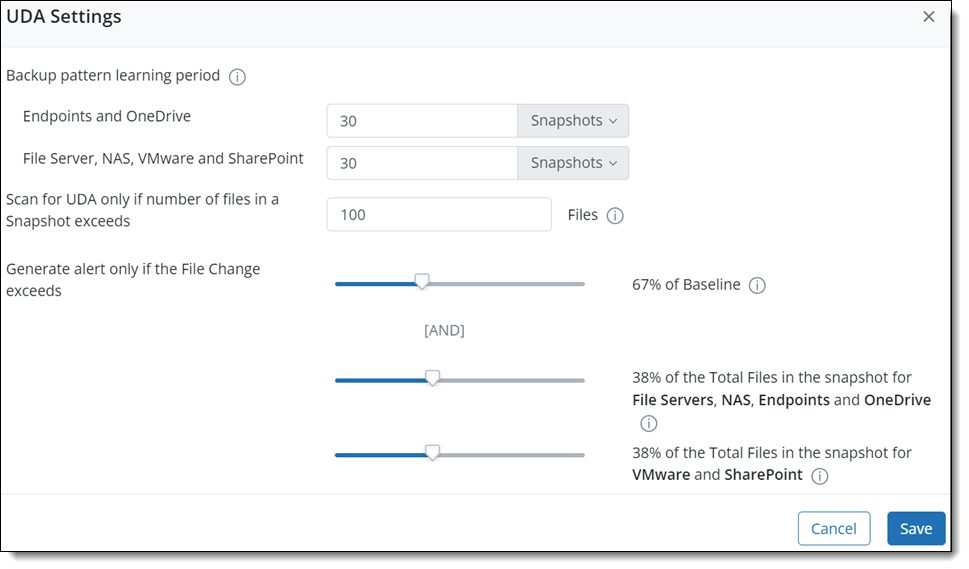
You can use the UDA Settings > Edit option to customize and update the UDA configuration settings as per your organizational requirements and if you are aware of the data backup patterns.
If you have selected snapshots as your data backup pattern learning period criteria, ensure that the learning duration is completed within 45 days.
The following table explains the UDA behavior for Endpoints, OneDrive, and File Server/NAS/VMware/SharePoint resources:
First backup is not considered for UDA detection.
Example
Scenario: UDA is enabled for a resource with the following UDA settings with total 500 files.
|
Backup Pattern learning period |
Minimum number of files required in a snapshot for UDA detection |
Maximum Deviation |
Minimum percent of total file change |
|
05 snapshots |
125 |
50% |
20% |
The following example explains the UDA behavior using the UDA settings mentioned in the table above.
For the first backup, there were 500 files backed up. Being the first backup, this will be excluded by the UDA algorithm.
Let's consider subsequent backups in the following trend:
| Snapshot# | Created | Modified | Deleted |
| 2 | 20 | 5 | 8 |
| 3 | 12 | 7 | 1 |
| 4 | 0 | 0 | 10 |
| 5 | 0 | 0 | 0 |
| 6 | 5 | 0 | 8 |
We have a total of 520 files after the 6th backup. Learning duration is complete - 05 Snapshots. UDA detection starts and alerts can be generated in case of anomaly.
Now, the baseline is as follows:
- Baseline for creation = maximum of new files created in the last learning duration of snapshots. i.e. Maximum of 20, 12, 0, 0, 5 which is 20
- Baseline for modification/update= maximum of modified/updated files in the last learning duration of snapshots. i.e. Maximum of 5, 7, 0, 0, 0 which is 7
- Baseline for delete=maximum of deleted files in the last learning duration of snapshots. i.e. Maximum of 8, 1, 10, 0, 8 which is 10
The baseline for creation, modification, and deletion is 20, 7, and 10 respectively.
Let's proceed with the next round of backups in the following trend:
| Snapshot# |
Created (Baseline for Creation) |
Modified (Baseline for Modification) |
Deleted (Baseline for Deletion) |
Total files in last backup |
| 7 |
10 (20) |
5 (7) |
7 (10) |
520 |
| 8 |
2 (Max of 12, 0, 0, 5, 10 = 12) |
1 (Max of 7, 0, 0, 0, 5 = 7) |
2 (Max of 1, 10, 0, 8, 7 = 10) |
523 |
| 9 |
100 (Max of 0,0,5,10,2 = 10) |
0 (Max of 0,0,0,5,1 =5) |
8 (Max of 10, 0, 8, 7,2 =10) |
523 |
| 10 |
80 (Max of 0,5,10,2, 100 =100 ) |
4 (Max of 0,0,5,1,0 =5) |
10 (Max of 0, 8, 7,2,8 =8 ) |
615 |
| 11 |
0 (Max of 5,10,2, 100, 80 = 100) |
12 (Max of 0,5,1,0, 4 = 5) |
8 (Max of 8,7,2,8, 10 = 10) |
685 |
| 12 |
5 (Max of 10,2, 100, 80, 0 = 100) |
50 (Max of 5,1,0, 4, 12 = 12) |
70 (Max of 7,2,8, 10, 8 = 10) |
677 |
| 13 |
200 (Max of 2, 100, 80, 0,5 = 100)
|
0 (Max of 1,0, 4, 12, 50 = 50) |
0 (Max of 2,8, 10, 8, 70 = 70) |
612 |
At the 9th snapshot, a creation alert is generated wherein 100 files are created and all the three required conditions are met:
-
Total number of files > minimum number of files required i.e.125
-
Baseline for creation = 10; number of files created > Baseline * max deviation
-
New files created > minimum percent of total files change
Similarly, at the 12th snapshot, modification and deletion alerts are generated as all three required conditions are met for both.
Administrators can take action based on the security policies of the organization to identify and isolate a possible threat and prevent additional losses.
Anomaly detection kicks in only after the backup job is complete and a snapshot is created. For incomplete backup jobs or interrupted backup jobs, no anomalous behavior is tracked.
View UDA alerts
Note: In the case of deleted resources (devices, sites, and backupsets) you cannot view the alerts for those resources. However, you can retrieve the deleted resources and view their alerts with the Rollback Action option.
Log in to Druva Console and go to Cyber Resilience > Security Events > Overview. The Unusual Data Activity Alerts card displays the number of active alerts in the defined time period.
.png?revision=1)
Being notified about the resources showing unusual data activity can help you identify a potential threat in your environment such as a ransomware attack or a compromised user. Click the card to view details of the generated alerts.
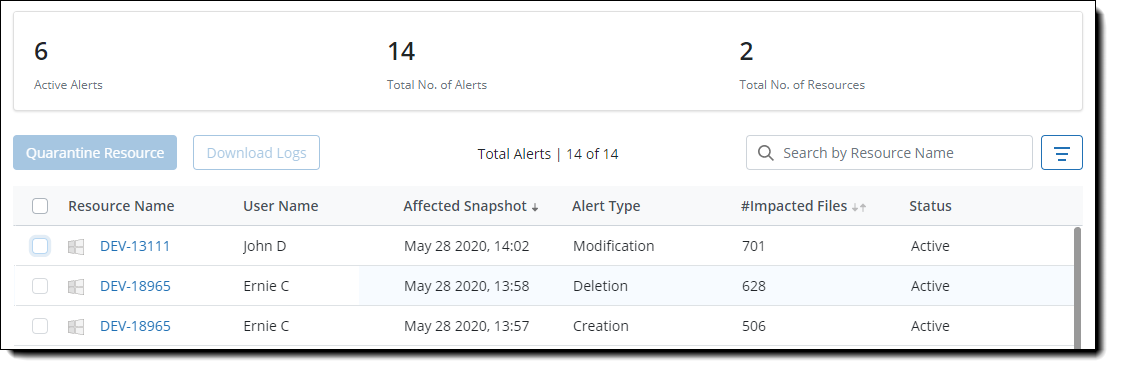
The details of the generated alert contain the following information:
- Resource Name: The name of the resource for which the alert was generated. Click to view the details of the alerts generated for this resource.
- User Name: The name of the user associated with the device. This field is displayed only for Endpoints and OneDrive.
- Server Name: The name of the server associated with the backupset. This field is displayed only for Servers.
- Virtual Machine Name: The name of the virtual machine. This field is displayed only for Virtual Machines.
- VCentre/ESXi hosts: The details of VCentre/ESXi hosts. This field is displayed only for Virtual Machines.
- Affected Snapshot: The date and time stamp of the snapshot that was affected.
- Alert Type: There can be the following alert types:
- Creation: Too many files created in a short span.
- Modification: A large number of files edited or modified.
- Deletion: Several files deleted from the snapshot.
- Encryption: Files encrypted and are inaccessible.
- #Impacted Files: The number of files in the affected snapshot. If there are multiple types of unusual behavior in the snapshot, there is an info icon beside the number that provides details of the unusual activity.
- Status: There can be the following two statuses:
- Active: Denotes that no action has been taken on the alert.
- Resolved: Denotes that the alert has been looked into and the necessary actions were taken.
You can also download the logs for a particular alert and use it for further inspection.
Click the name of the resource to view the details of the resource and the alerts generated for that resource. The following screenshot displays Summary card for Endpoints.
The Data Activity Trend is a graphical representation of data backed up in the resource by snapshots.
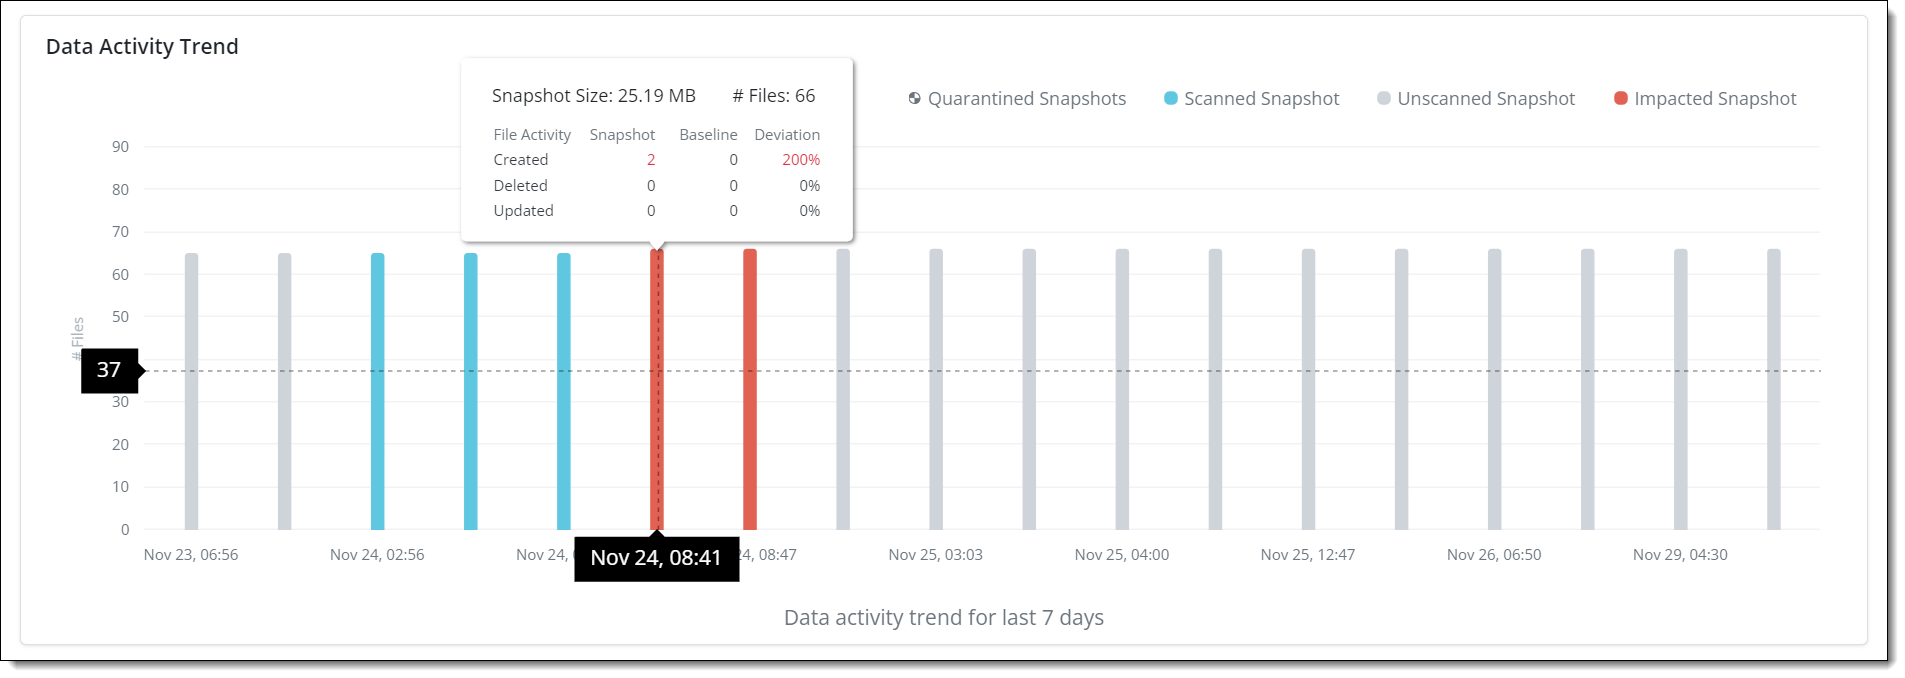
Hover over the graph to view the following details of Unusual Data Activity for files:
-
Type of snapshots represented by different color codes:
-
Unscanned Snapshots
: Indicates either of the following
-
Learning period is in progress for the data backup pattern analysis
-
Snapshot does not comply with the minimum files required parameter set
-
-
Scanned Snapshots
: Indicates learning period and UDA detection is complete, and no data anomaly is detected. Snapshots are safe.
-
Impacted Snapshots
: Indicates learning period and UDA detection is complete. Data anomaly is detected within snapshots, and a UDA alert is generated for you to take action.
-
Quarantined Snapshots
: Indicates quarantined snapshots and needs further investigation by the security team.
-
-
Snapshot Size: The size of the snapshot
-
#Files: Number of files included in the snapshot
-
File Activity: The action performed on the file - Created, Updated, Deleted, and Encrypted
-
Snapshot: The snapshot count for each file activity - Created, Updated, Deleted, and Encrypted
-
Baseline: This value is generated dynamically from the list of snapshots based on the learning duration.
Note: Baseline values are not applicable for Encrypted files.
-
Deviation: The change of anomaly observed with reference to the baseline value. The deviation could be a positive or negative number and is displayed in percentage.
Note: Deviation is not applicable for Encrypted files.
Take action on an alert
For any unusual data activity alert, you can do any of the following:
- Ignore the alert: If you deem any alert as a false positive, click the resource name and select the false positive alert. Click Ignore to resolve the alert.
- Quarantine the resource: Select an alert and click Quarantine Resource to stop the ransomware from spreading further. Before you quarantine, see Know the impact of quarantining to learn more about the effects of quarantining the resource. To learn about the options to quarantine a resource, see Quarantine Response.
- You can also download the logs for a particular alert and use them for further inspection.
Note: For each backup of all workloads, you can download logs for up to 1.5 million files.
The downloaded logs provide information about the following:
- File Name: Name of the file
- File Type: The type of file. For example, .txt
- File Size (Bytes): Size of the file
- File Modified Timestamp: The date and time when the file was modified
- Operation: The operation performed on the file. For example: File created, file modified, file deleted, file encrypted
- SHA1 Checksum (Only for Endpoints, OneDrive, and SharePoint): The SHA1 Checksum value of the file
- File Owner (Only for Endpoints, OneDrive, and SharePoint): The details of the file owner
- File Created Timestamp (Only for Endpoints, OneDrive, and SharePoint): The date and time when the file was created
-
File Modified By (Only for OneDrive, and SharePoint): The date and time when the file was modified.
In case of encryption, the downloaded logs will contain details for a maximum of 100 encrypted files.
After you have taken an action, the status of the alert changes to Resolved.
Here is a quick preview of the enhanced Unusual Data Activity.