Monitor Nutanix AHV jobs
Overview
The All Jobs page within the Protect > Nutanix AHV page in the Management Console displays a list of all backup, restore, and log request jobs. The All Jobs page shows the progress of each Nutanix job. On the Job details page for every job, you can see the job details and the logs.
To access the Nutanix All Jobs page, perform the following tasks:
- Log in to the Management Console.
- Select your Organization if Organizations are enabled.
- On the menu bar, click Protect > Nutanix AHV.
- In the left navigation pane, click All Jobs. The following table lists the fields on the All Jobs page.
Field Description Job ID A unique identification number associated with the job. Click on the job ID to view the job details. For more information, see View job summary. You can also view the logs of each job. For more information, see View job logs. Job Type The type of job operation, such as Backup, Restore, and Log Request. You can also filter the jobs based on the type of operation. VM Name The name of the virtual machine for which the job was initiated. Prism The name of the Prism Element or Prism Central on which the virtual machine resides. Start time The time when the job operation started. End time The time when the job operation completed. Status The status of the job:
- Queued: The triggered jobs that are waiting to be processed.
- Running: The jobs that are being processed. After the estimation is complete, the percentage of data uploaded to the cloud is displayed.
- Successful: The jobs were completed without any errors.
- Completed with errors : The jobs that completed with a few errors.
- Failed: The jobs that did not complete successfully.
- Note: A failed job is displayed with an error code. Hover on the error code to view the error message. The error code hyperlink redirects to the exact error message description on the documentation portal.
- Canceled: The jobs that were canceled.
- Waiting for retry: The jobs that failed in the previous attempt and are waiting to be processed again. A job is retried twice within an interval of 10 minutes.
- Skipped: The jobs that did not start within the scheduled window because another job was in progress or the Hybrid Workloads agent or proxy picked the job after the scheduled backup window.
- Backup Window Expired: The list of backup jobs Phoenix could not complete because the entire data set was not backed up within the specified duration, and a restore point was not created.
- Scanning: The jobs that are still being scanned.
- Scan failed: The jobs for which the scan has failed.
View Job Summary
On the All Jobs page, click the Job ID of the job whose summary details you want to see. Based on the type of operation (Backup, Restore, or Log Request), the job summary is displayed.
The Summary page is divided into five sections:
| Job Details | Data Estimation | Data Transfer |
| Environment Details |
(For restore jobs) |
Job Details
| Field | Description |
|---|---|
| Job ID | The unique identification number associated with the job. |
| Prism | The Prism Element or Prism Central that hosts the VM which was backed up or restored. Clicking the hyperlink takes you to the All Virtual Machines page for that Prism. |
| Start Time | The time when the backup or restore operation started. |
| End Time | The time when the backup or restore operation finished. |
| Job Type |
The type of operation. The field displays
|
| Status |
The status of the job:
|
|
Error Code (In case of failures) |
A hyperlinked error code is displayed if the job failed. The link takes you to the documentation portal, where you can find a description and resolution for the error. |
| Error Message (In case of failures) |
The error message is displayed if the job has failed. |
| Backup Policy | The backup policy associated with the VM that was backed up. |
| Recovery point Used | The recovery point used for the restore job. |
| Backup Proxy used for the job | The Backup proxy used by the backup or restore job. |
| VM Name | The virtual machine that was backed up, restored, or for whom logs were requested. |
Data Estimation
| Field | Description |
|---|---|
| Source Data Scanned | The source data scanned for backup. |
| #vDisk(s) Removed | The total number of vDisks that were removed with respect to the previous backup. |
| #vDisk(s) Changed | The total number of vDisks that changed with respect to the previous backup. |
| #vDisks(s) Added | The total number of new vDisks that were added with respect to the previous backup. |
| Time Taken for Estimation | The approximate time taken to scan the data. The time taken for estimation does not include network retry time. |
Data Transfer
| Field | Description |
|---|---|
| Data Transferred to Cloud | The data that is directly uploaded to Cloud after deduplication and compression. |
| Backup Speed | The ratio of source data scanned and uploaded to the backup duration. |
| Backup Duration | The time that it took for the backup to complete and the data to be uploaded to the cloud. This excludes the time it took to run data estimation, network retries, and automatic waiting for retries. |
| Restored Data (For restores) |
The total amount of data restored.
|
|
Job Speed (For restores) |
The rate at which the data is restored. The restore speed is specified in GB/Hr. |
| Bandwidth Consumed (For restores) |
The bit rate to transfer data to the cloud. |
Environment Details
| Field | Description |
|---|---|
| #Network Retries | The number of network retry attempts made within a job session. |
| Network Retry Duration | The total time spent in the network retries. It represents the cumulative of all network disconnection duration. |
|
Disk Read Rate (For backups) |
The bit rate for reading I/O by the agent. The Disk Read Rate is an average of the total data read with respect to the total time taken to read data at various intervals for all drives where data is distributed. |
|
Disk Write Rate (For restores) |
The bit rate for writing I/O by the agent. The Disk Write Rate is the average of the total data written with respect to the total time taken to write data at various intervals. |
Restore Location
| Field | Description |
|---|---|
| Destination Prism | The destination Prism Element or Prism Central where the data was restored. |
| Backup Proxy Pool | The Backup proxy pool used by the restore job. |
| Destination Cluster | The destination cluster where the data was restored. |
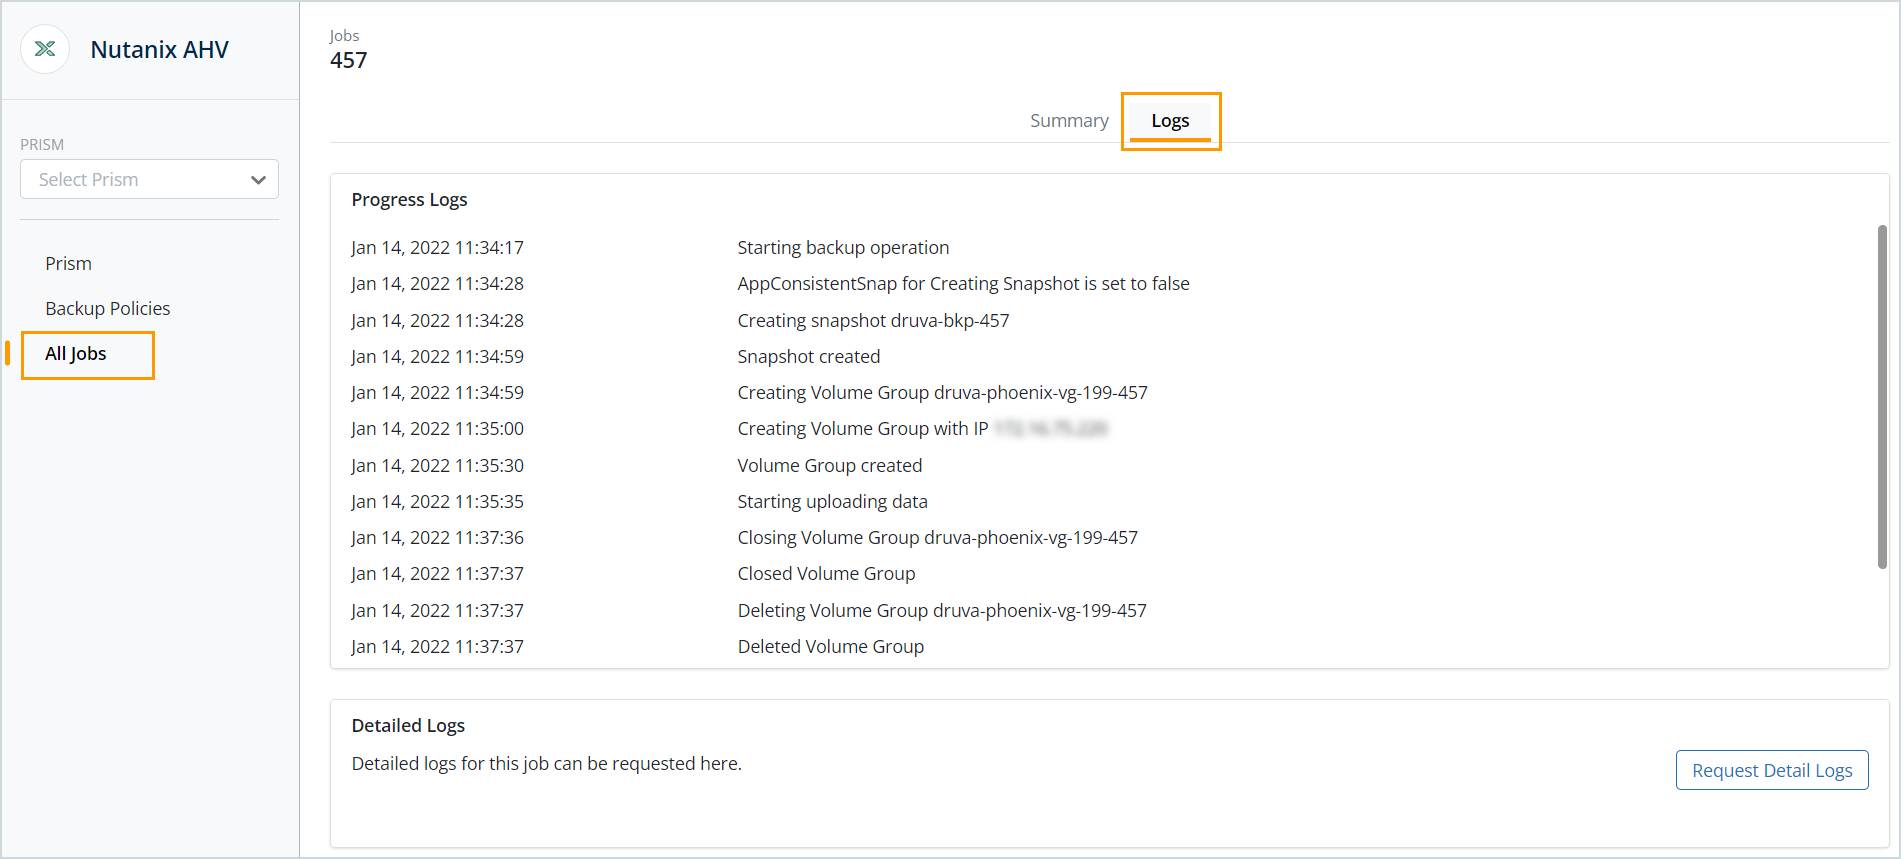
View job logs
The Logs page displays the following information in each section:
| Section | Description |
|---|---|
| Progress Logs |
Displays the progress logs for the selected job.
|
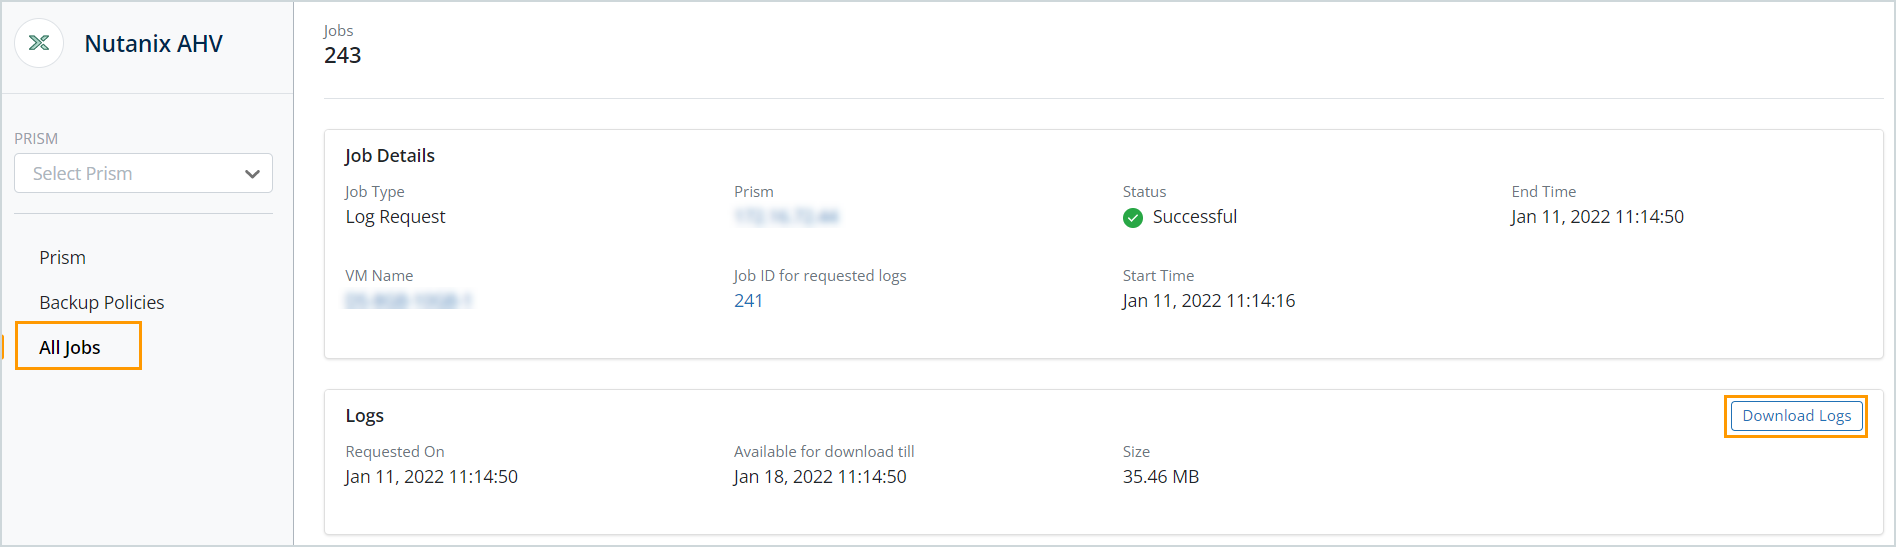
| Detailed Logs |
The detailed logs for the selected job. You can download the logs within seven days of the request.
|
By default, Druva displays the timestamps for each job following the administrator time zone. If you set a time zone when updating your account details, the timestamps follow the changed time zone. Both system and progress logs will follow the administrator's time zone.
- Log in to the Management Console.
- Select your Organization if Organizations are enabled.
- On the menu bar, click Protect > Nutanix AHV.
- In the left navigation pane, click All Jobs.
- Click on the Job ID and click on the Logs tab.
- You can view the progress logs of the respective operation for a job.
- To download the detailed logs for the job, click Request Log Jobs.
- After you receive an email, the Download Detailed log button is activated. Click the button to download the log zip file.
Upload requested logs
The log files are used to analyze and troubleshoot the issues you might encounter while performing a task. For assistance in resolving the issues, you can share the log files with technical support.
Note: Process logs are only available for backup and restore jobs.
The detailed logs include the following:
| Common logs for Window, Linux, and backup proxy | Window logs | Linux logs | Backup proxy logs |
|---|---|---|---|
| Druva Phoenix Config | Window event/Application logs | Dmesg logs | Nutanix logs |
| Agent-specific Logs | VSS information | System information | |
| Main Service logs |
You can request job logs within 30 days of triggering the job. You must download the requested logs within 7 days of triggering the request.If the log file is 4.5 MB or smaller, you can send it to technical support as an email attachment. If the log file exceeds 4.5 MB in size, perform the following tasks to send the logs to support:
- Go to https://upload.druva.com/
- Enter the case number in the Ticket Number field.
- Click Choose File, and add the compressed files to upload.
- Click Upload. Notify the support engineer that the logs have been uploaded on the portal by responding to the ongoing support ticket email.