Monitor CloudCache usage
 Business
  Enterprise Elite
You can get information and graphs about the CloudCache usage, the current version of the CloudCache instance, and the estimated un-sync data for the configured CloudCache instances on the Management Console. You can regenerate the activation token, configure the CloudCache instances, and upgrade the CloudCache instances that you have configured.
On the Manage CloudCache > All Devices page, you can view the information on the following tabs:
Unconfigured tab
On the Unconfigured tab, you can view the list of activated CloudCache instances. You can perform the following actions on these instances:
- Configure CloudCache .
- Regenerate activation token . ( Not applicable for CloudCache R3)
- Delete CloudCache .
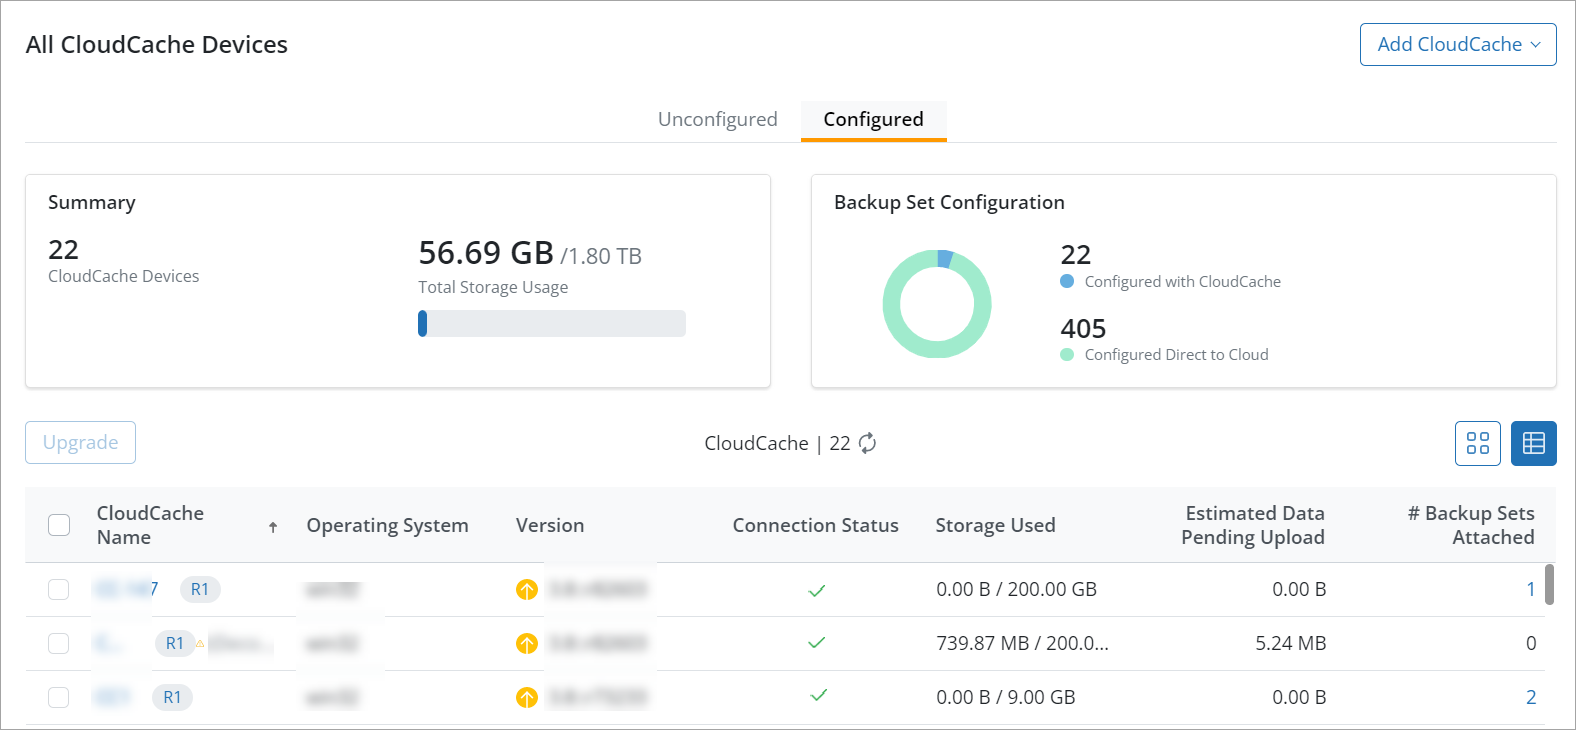
Configured tab
On the Configured tab, you can view the list of configured CloudCache instances. The Summary section provides information about the number of configured CloudCache, the storage usage and the total allocated size. This information can help administrators to plan and monitor the usage of the CloudCache server. The Backup Set Configuration section provides information of the total number of backup sets configured to the CloudCache and to the Druva Cloud. Additionally, you also get the information about the version, connection status, and the amount of data on the CloudCache server that is yet to be synced to the Druva Cloud.
Data sync trend (Last 30 days)
On the CloudCache details page, you can get information about the data synchronized to CloudCache and the data pending to be synchronized to the CloudCache in last 30 days.
