Monitor SQL jobs
 Business Enterprise Elite
 All Jobs
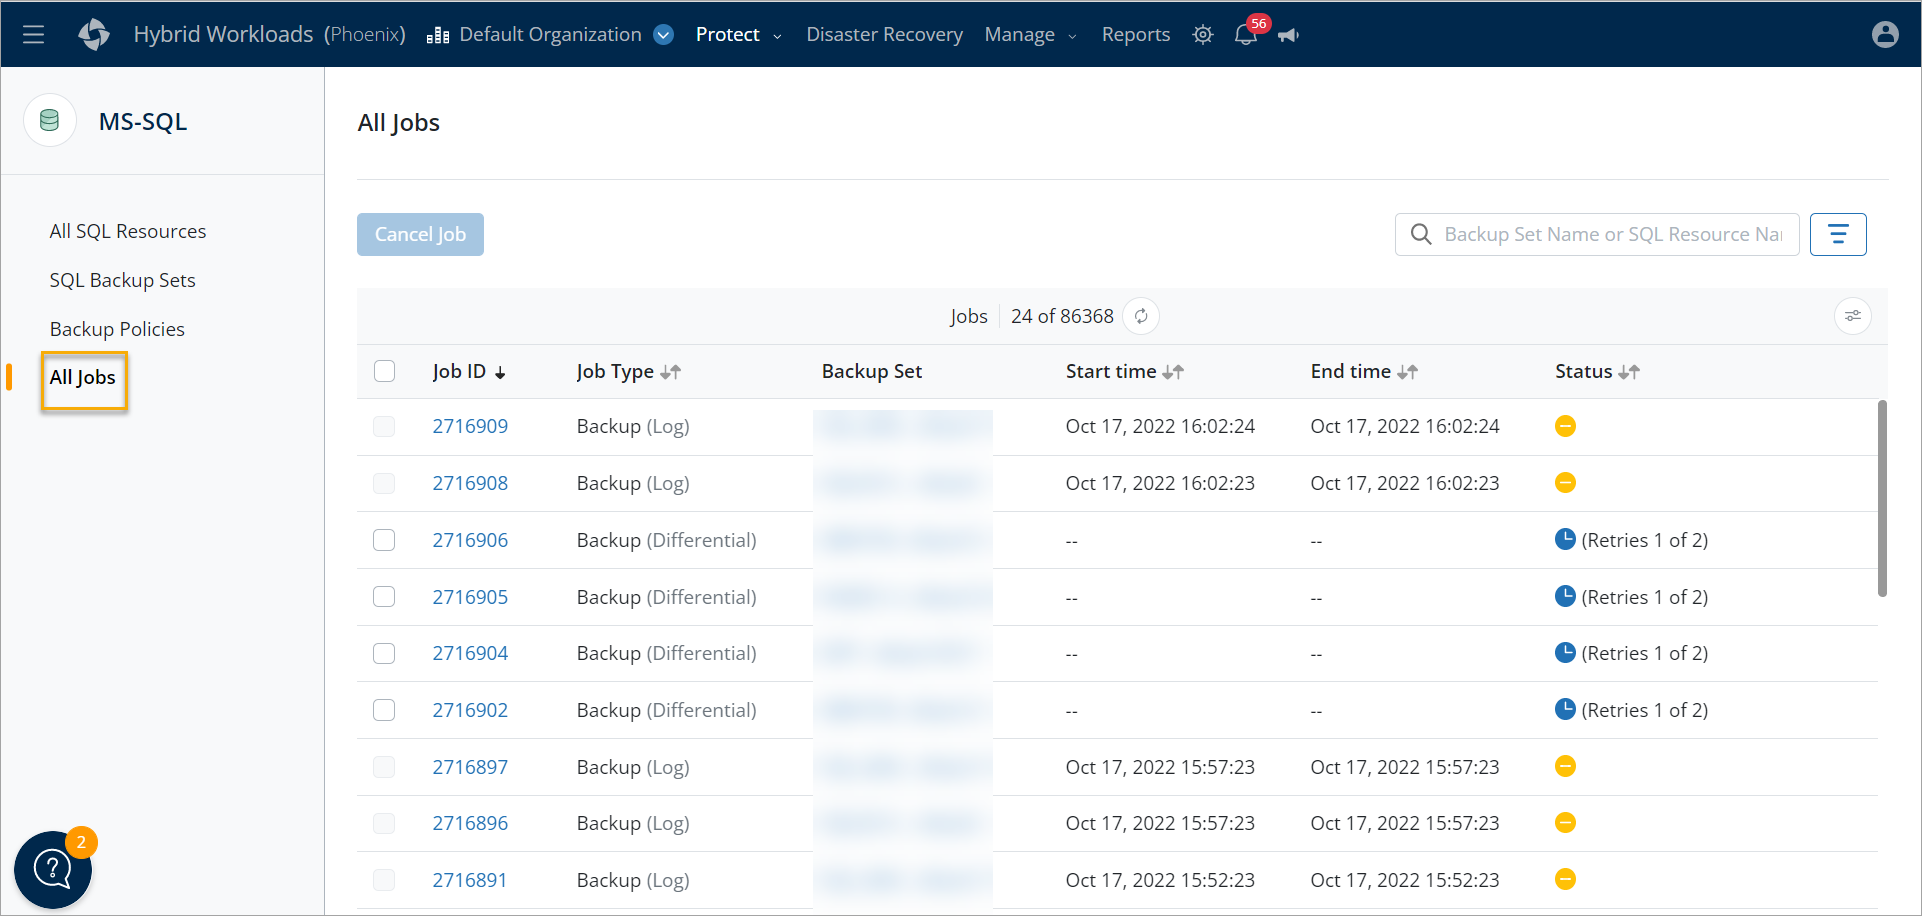
The All Jobs page within the Protect > MS-SQL servers page in the Management Console displays a list of all backup, restore, and log request SQL jobs. This page shows the progress of each SQL job. Job details are available for all jobs where you can see the summary of a job and the logs associated with it.
To access the MS-SQL servers Jobs page, perform the following tasks:
- Log in to the Management Console.
- Click Protect > MS-SQL servers. Note that if the All Organizations menu is enabled, you have to first select an organization that has the SQL server and then click Protect > MS-SQL servers.
- In the navigation pane on the left, click Jobs. The right pane displays the following data:
| Field | Description |
|---|---|
| Job ID | A unique identification number associated with the job. |
| Job Type | The type of job operation, such as Backup (Full), Backup (Differential), Backup(Log), Restore, and Log Request. |
| Backup Set | Name of the SQL backup set for which the job was created. |
| Start time | The time when the job started. |
| End time | The time when the job ended. |
| Status | The status of the job. For more information, see Job Status. |
Filters
You can filter jobs by Job Type, Status, and Started in.
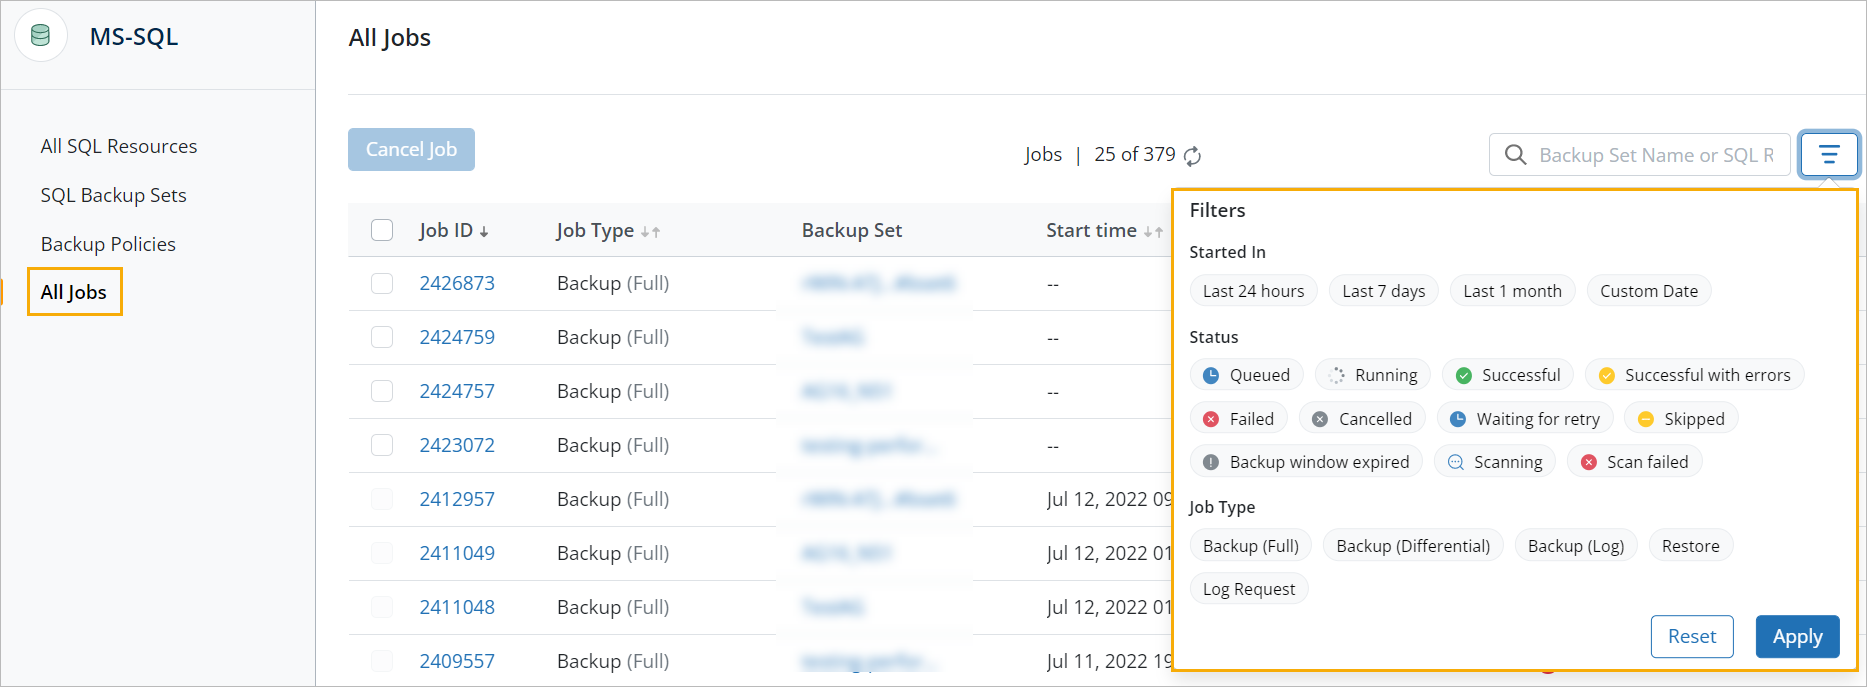
You can filter jobs by the following Job Types:
- Backup (Full)
- Backup (Differential)
- Backup (Log)
- Restore
- Log Request
You can filter jobs by Status:
- Queued
- Running
- Successful
- Successful with errors
- Failed
- Cancelled
- Waiting for retry
- Skipped
- Backup window expired
- Scanning
- Scan failed
You can also filter jobs that Started in:
- Last 24 hours
- Last 7 days
- Last 1 month
- Custom Date
Note: You can choose a specific date range.
The Job ID and the Backup Set values are clickable. Clicking the Job ID value for a SQL job takes you to the job details page. Clicking the value in the Backup Set column takes you to the backup set details page.
From the Jobs page within the Protect > MS-SQL servers page, click the Job ID of the job whose details you want to view. The jobs details page is divided into the Details tab, and the Logs tab.
Customize table columns
You can customize the table columns using the Customize Table Columns icon .
This will give a list of the columns on that page. You can display a particular column, hide unnecessary columns to make the UI more spacious, and move a column to reorder the table.
Note: The column configuration persists across sessions in the same browser.
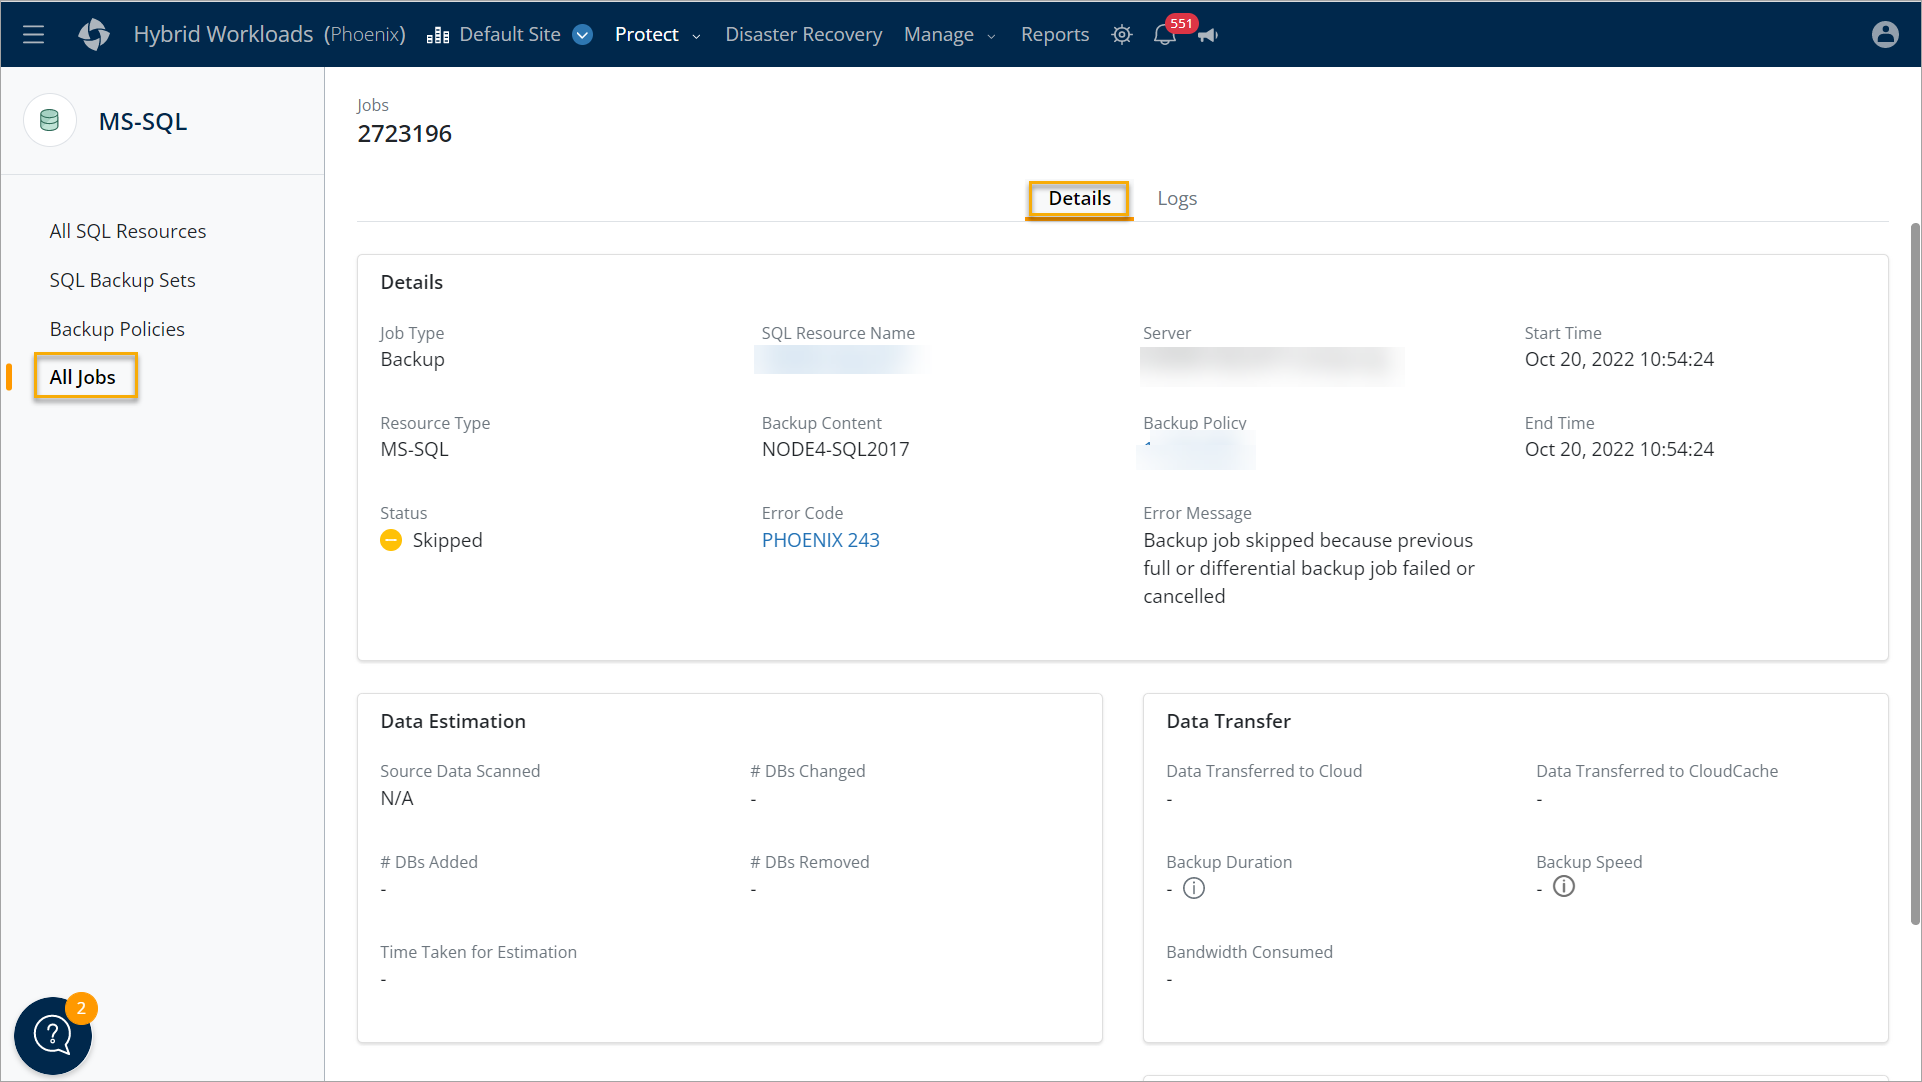
Details
The Details tab is divided into the following sections:
| Details | Data Estimation |
| Data Transfer | Environment Details |
Details
The Details section has the following information:
| Field | Description |
|---|---|
| Job Type | The type of job that was executed. This can be Backup(Full), Backup(Differential), Backup(Log),Restore, or Log request. |
| SQL Resource Name | The name of the SQL database instance or Availability Group. |
| Resource Type | The type of resource. For SQL servers this is MS-SQL. |
| Backup Content | The number of databases included in the backup. |
| Backup Policy | The backup policy associated with the SQL backup set |
| Server | The name of the SQL server. |
| Start Time | The time when the job started. |
| End Time | The time when the job ended. |
| Tail Log Backup | This field is displayed for a restore job if it has an associated tail-log backup. |
| Status | Completion status of the job |
Data Estimation
The Data Estimation section has the following fields:
| Field | Description |
|---|---|
| Source Data Scanned | The amount of data scanned at the source for the backup. |
| # DBs Changed | The total number of databases that were changed as compared to the previous backup. |
| # DBs Added | The total number of databases that were added as compared to the previous backup. |
| # DBs Removed | The total number of databases that were removed as compared to the previous backup. |
| Time Taken for Estimation | The approximate time taken to scan the data. The time taken for estimation does not include network retry time. |
Data Transfer
The Data Transfer section has the following details:
| Field | Description |
|---|---|
| Data Transferred to Cloud | The incremental data that is directly uploaded to Cloud after deduplication and compression. |
| Data Transferred to CloudCache | The incremental data that is directly uploaded to CloudCache after deduplication and compression. |
| Backup Duration | The total time taken to upload data to Cloud and CloudCache. Backup duration excludes the estimation time, network retry time, and the waiting for retry time. |
| Backup Speed | The rate at which the source data is scanned for backup. |
| Bandwidth Consumed | The bit rate to transfer data to cloud and CloudCache. |
Environment Details
The Environment Details section has the following details:
| Field | Description |
|---|---|
| Disk Read Rate | The bit rate for reading I/O by the agent. The Disk Read Rate is an average of the total data read and the total time taken to read data at various intervals for all drives where data is distributed. For UNC Shares, the Disk Read Rate is the average value of drive(s). |
| # Network Retries | The number of network retry attempts made within a job session. |
| Network Retry Duration | The total time spent in network retries. It is cumulative of all network session duration. |
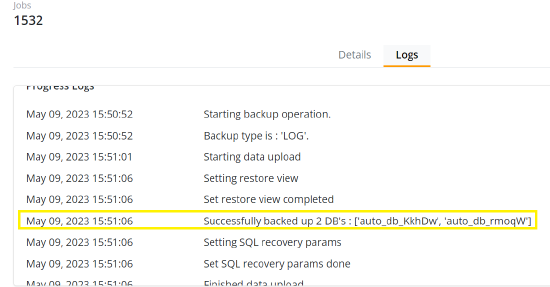
Logs
Log files help analyze and troubleshoot issues encountered while performing a task. You can share the logs with Druva Technical Support to aid in issue resolution.
Progress Logs
Displays the progress logs of the job.
For backup jobs, you can see the names of databases successfully backed up.
Detailed Logs
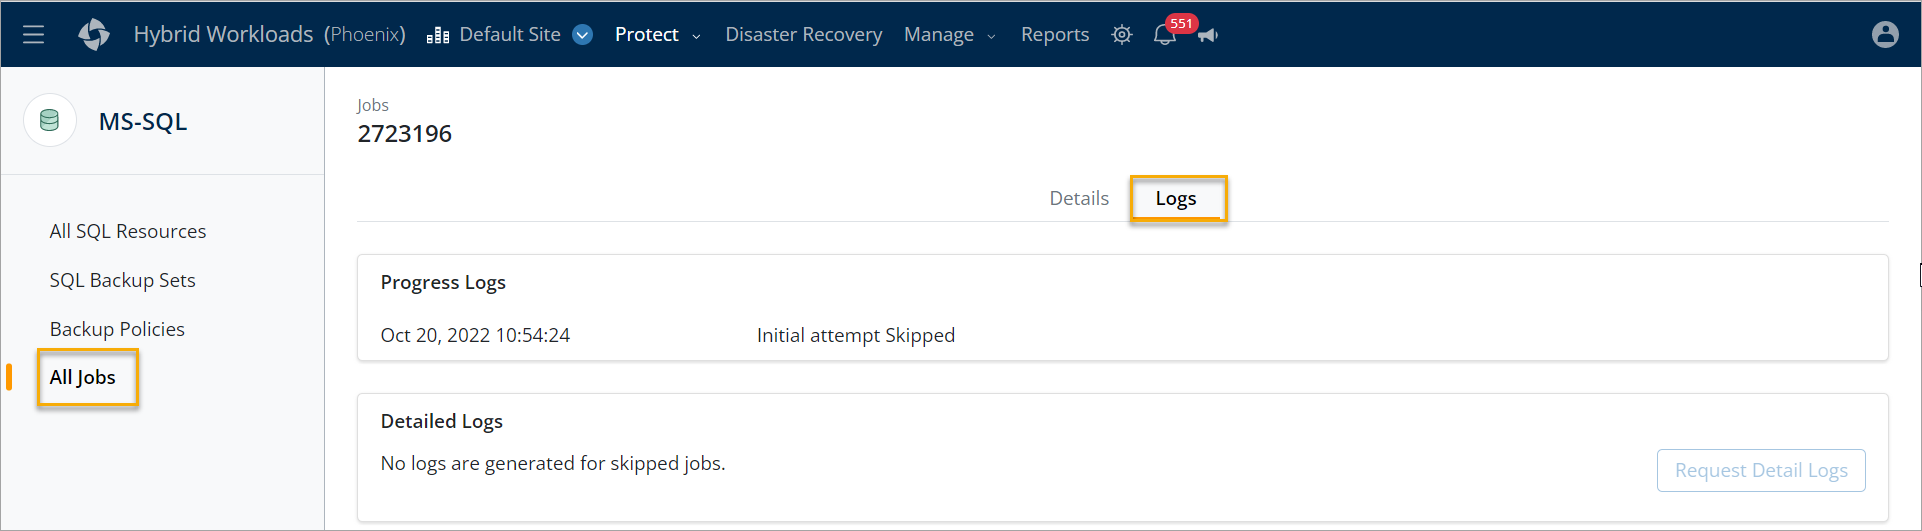
The Detailed Logs section gives you the option to Request Detailed Logs. Detailed logs are available only after the upload job completes. Till then, the Request Detailed Logs button remains disabled. The logs are available for download till a certain date and time specified under the Available for download till field. The Requested on field shows you when the request for detailed logs was made.