Administrative Group Details page
 Business Enterprise Elite
This topic provides instructions for viewing the administrative group details.
- Log in to Druva Cloud Platform Console.
- Click
 > Enterprise Workloads > Select the required organization from the All Organizations menu, and then click Manage > Administrative Groups.
 - The Manage Administrative Groups page displays a list of available administrative groups.
- You can click the administrative group for which you want to view details.
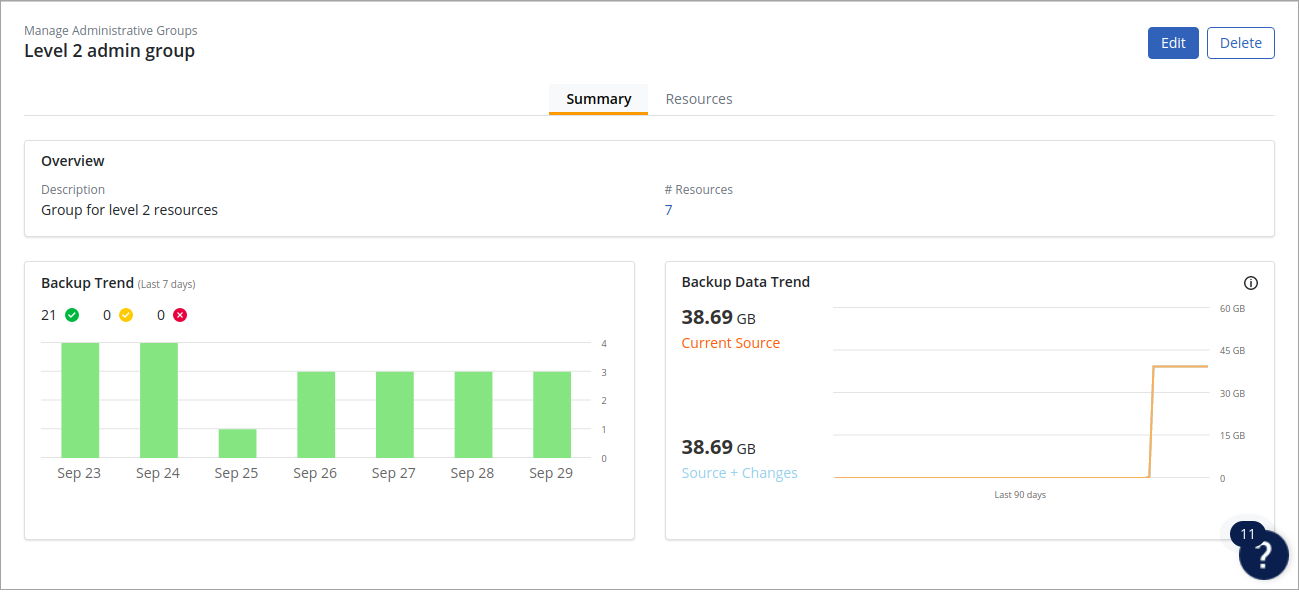
- The Summary tab of the administrative group details page displays the following fields:

| Field | Description |
|---|---|
|
Description |
The description for the administrative group. |
|
# Resources |
The number of servers associated with the administrative group. |
|
Backup Trend |
The Backup Trend section displays backup jobs for the last seven days with the following three statuses:
For the detailed explanation of each parameter, see Dashboards. |
| Backup Data Trend |
The Backup Data section illustrates the following data for the last 90 days: Source + Changes: The amount of backup data generated at the source. This includes the initial full backup and incremental data from all subsequent backups. Current Source: The size of the data on the source server(s) at the time of the last backup. |
The Resources tab of the administrative group details page displays the following fields:
| Field | Description |
|---|---|
|
Name |
The name of the resource. |
|
Resource Type |
The type of resources such as Physical Server, VMware VM, Hyper-V VM, NAS Share, SQL Availability Group, Phoenix Store, and SQL Standalone Instance. |