Monitor Hyper-V jobs
 Business Enterprise Elite
 Overview
This topic provides instructions for viewing jobs, filters, summary, and logs using the Jobs details page.
Jobs
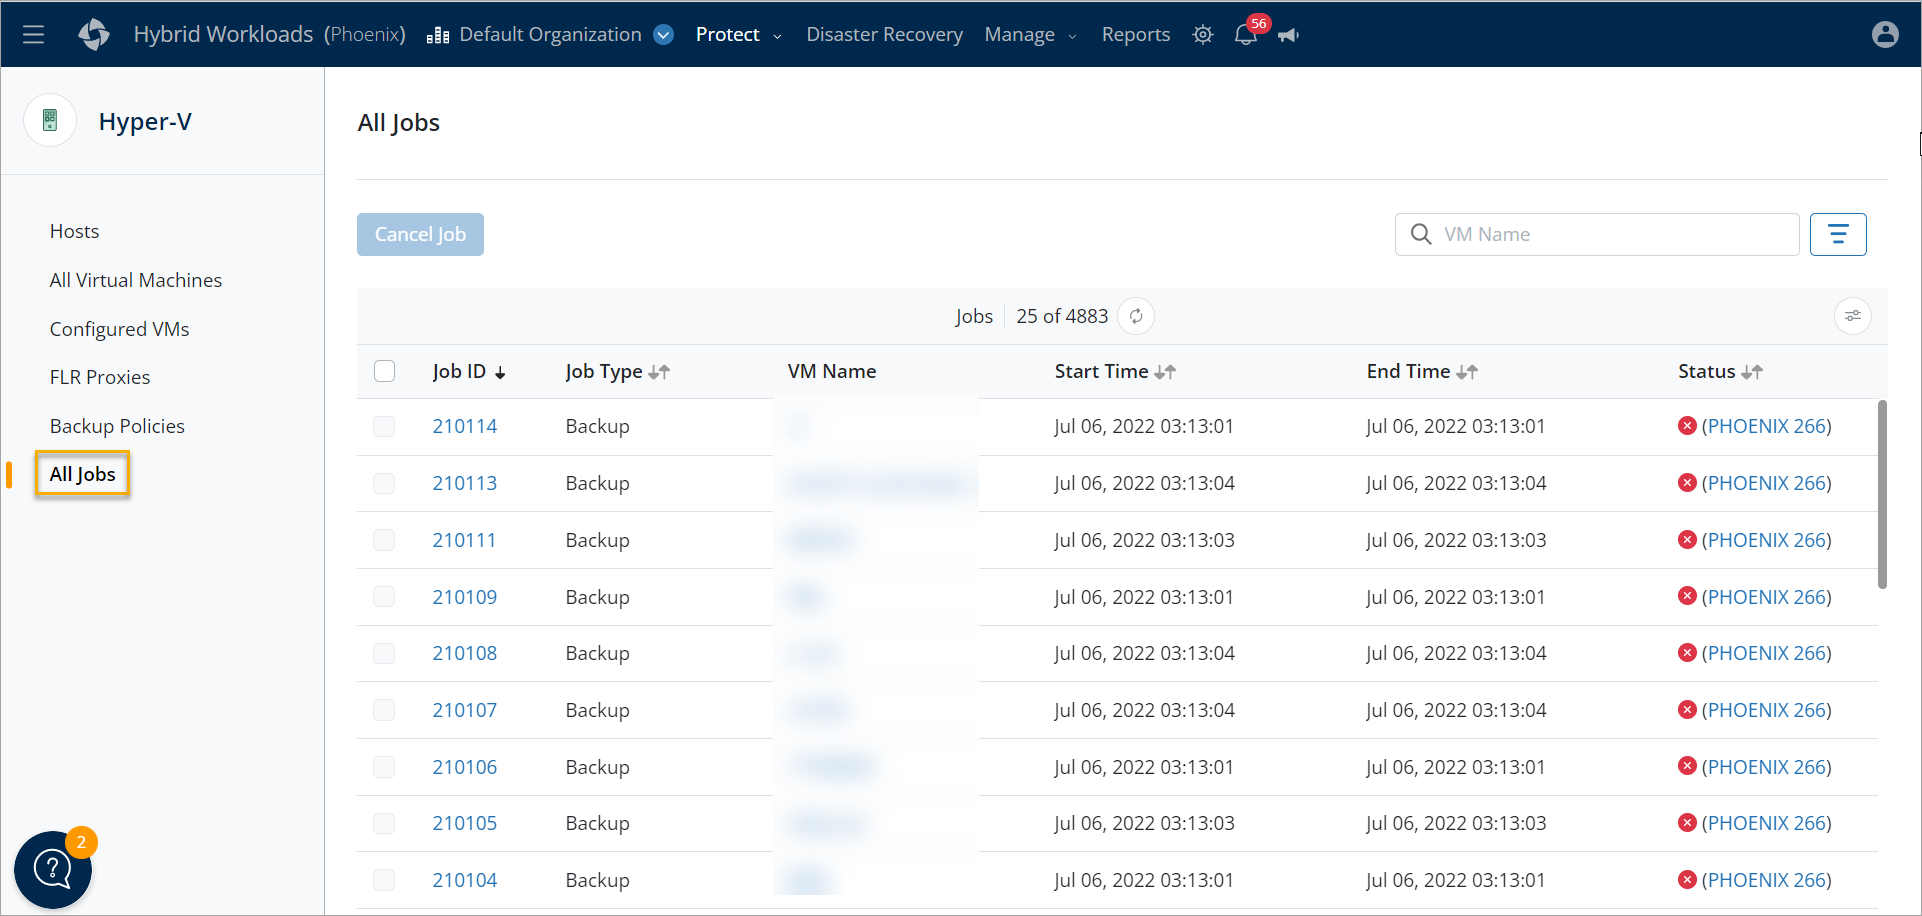
The All Jobs page within the Protect > Hyper-V page in the Management Console displays a list of all backup, restore, and log request Hyper-V jobs. The All Jobs page shows the progress of each Hyper-V job. Job details are available for all jobs where you can see a summary of the job and the logs associated with it.
To access the Hyper-V Jobs page, perform the following tasks:
- Log in to the Management Console.
- select the workload from the Protect menu. Note that if the All Organizations menu is enabled, you have to first select an organization and then select the workload.
- In the navigation pane on the left, click All Jobs. The right pane displays the following data:
Field Description Job ID A unique identification number associated with the job. Job Type The type of job operation, such as Backup, Restore, and Log Request. VM Name The name of the virtual machine, for which Druva initiates the job. Start time The time when the job started. End time The time when the job ended. Status The status of the job. For more information, see Job Status.
Filters
You can filter jobs by Job Type, Job Status, and Started in.
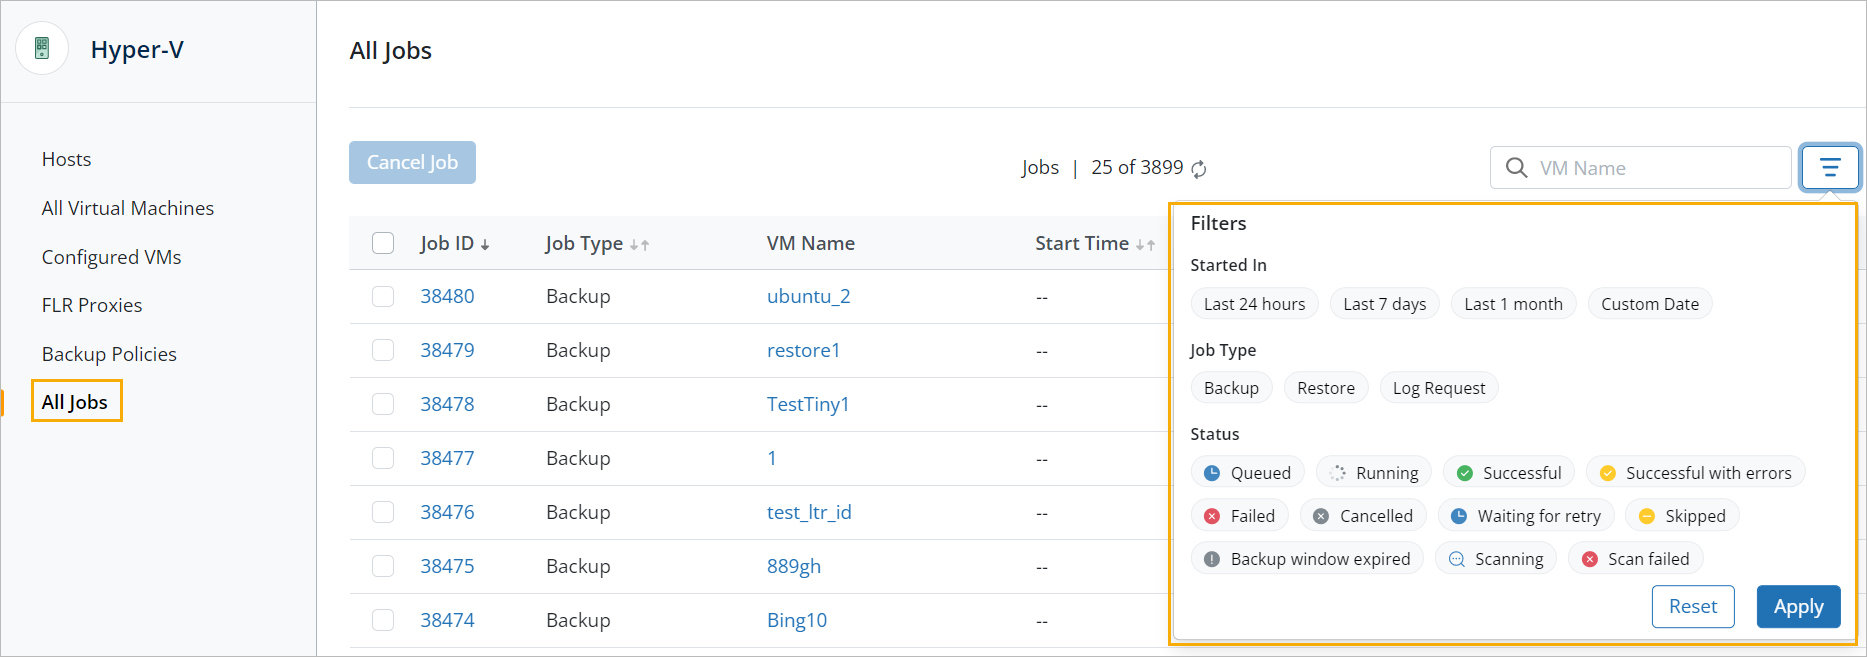
You can filter jobs by the following Job Types:
- Backup
- Restore
- Log Request
You can filter jobs by Status:
The Status filter allows you to filter jobs based on their statuses.
- Queued: The triggered jobs that are waiting to be processed.
-
Running: The jobs that are being processed.
-
Successful: The jobs processed without any errors.
-
Successful with errors: The jobs that are processed but have some errors.
-
Failed: The jobs that were not processed successfully.
Note: A failed job is displayed with an error code. Hover on the error code to view the error message. The error code hyperlink redirects to the exact error message description on the documentation portal.
-
Canceled: The jobs that were canceled.
-
Waiting for Retry: The jobs that failed in the previous attempt and waiting to be processed again.
Note: By default, Druva retries a job twice with a ten-minute interval between the two attempts.
Backup Retry ensures the following:
- Higher backup success rate, if a backup is failing due to transient issues in your environment.
- Optimum utilization of the scheduled window.
The backup retry for a job is performed only if a job fails. Druva does not perform backup retry for jobs that have successfully finished but with errors.
An automatic job retry is not triggered for a manually triggered job.
-
Skipped: The jobs that did not start within the scheduled window because another job is in progress.
-
Backup window expired: The list of jobs Druva could not complete because the entire data set was not backed up within the specified duration, and a recovery point was not created.
-
Scanning: The jobs that are still being scanned.
-
Scan failed: The jobs for which the scan has failed.
You can also filter jobs that Started in:
- Last 24 hours
- Last 7 days
- Last 1 month
- Custom date
Note: You can choose a specific date range.
The Job ID and the VM Name values are clickable. Clicking the Job ID value for a Hyper-V job takes you to the job details page. Clicking the value in the VM Name column takes you to the Configured VMs details page.
From the All Jobs page within the Protect > Hyper-V page, click the Job ID of the job whose details you want to view. The jobs details page is divided into the Summary tab, and the Logs tab.
Customize table columns
You can customize the table columns using the Customize Table Columns icon .
This will give a list of the columns on that page. You can display a particular column, hide unnecessary columns to make the UI more spacious, and move a column to reorder the table.
Note: The column configuration persists across sessions in the same browser.
Summary
The Summary tab is divided into the following sections:
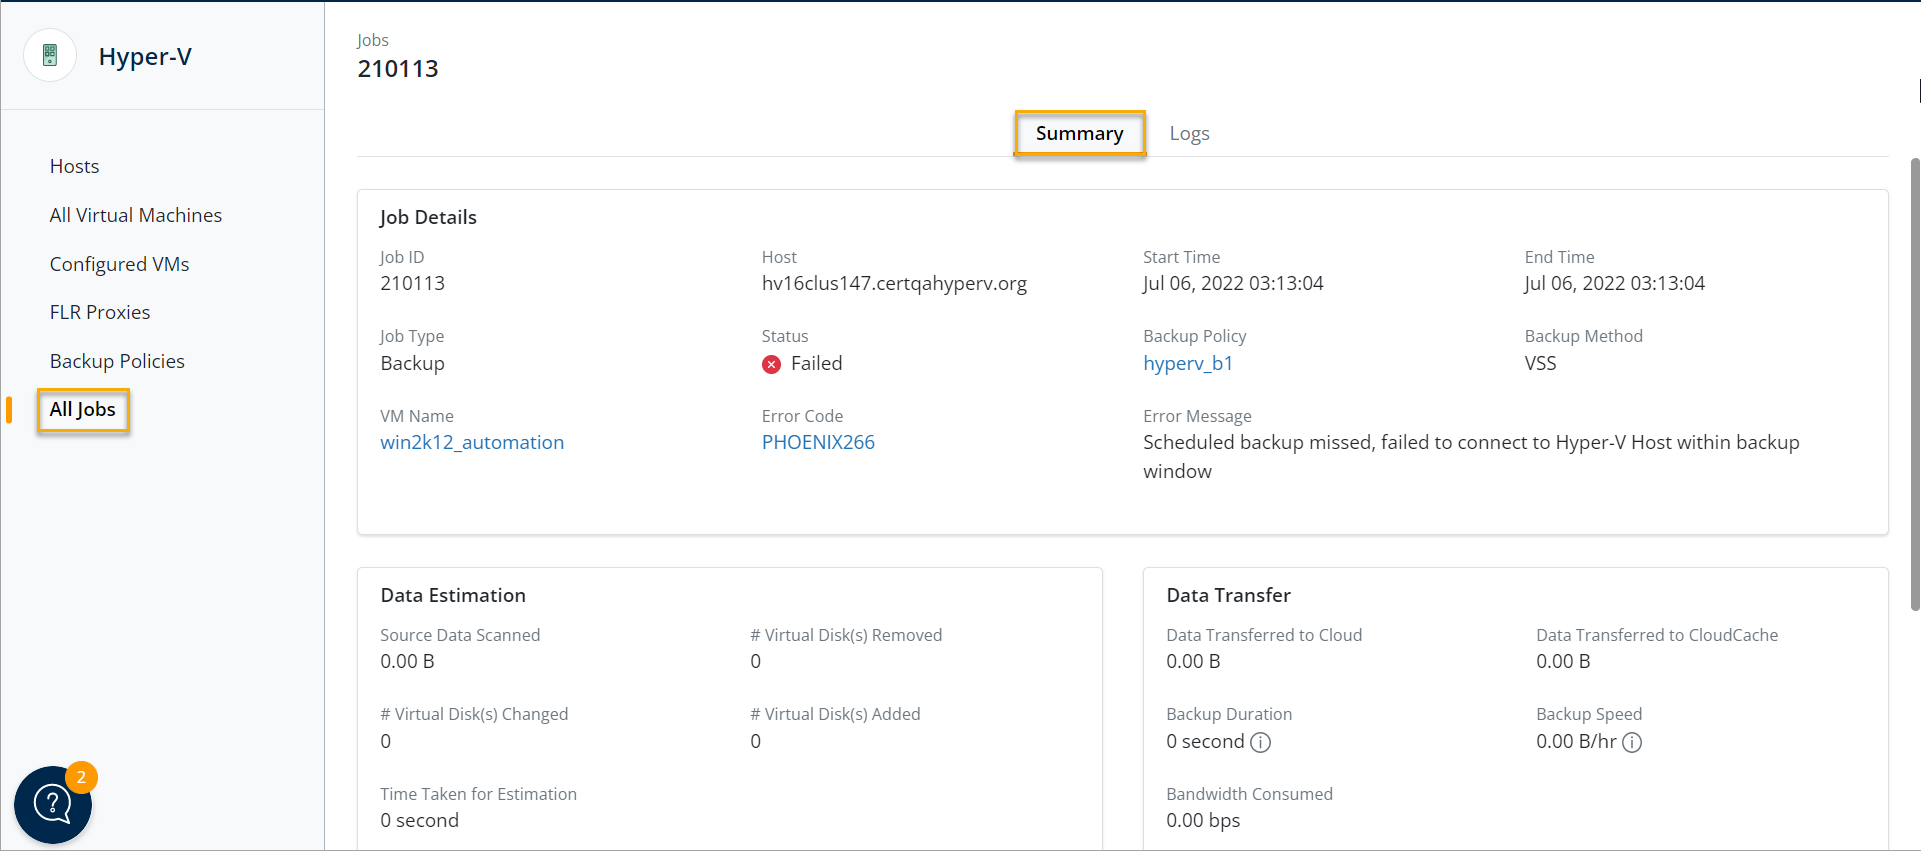
Job Details
The Details section has the following information:
| Field | Description |
|---|---|
| Job ID | A unique identification number associated with the job. |
| Job Type | The type of job operation, such as Backup, Restore, and Log Request. |
| VM Name | The name of the virtual machine, for which Druva initiates the job. |
| Host | The host on which the virtual machine is running. |
| Status | The status of the job. For more information, see Job Status. |
| Error Code | The error code displayed if the backup operation fails. You can click the error code to open the troubleshooting documentation. |
| Start time | The time when the job started. |
| End time | The time when the job ended. |
| Backup Policy | The backup policy associated with the server or virtual machine. |
| Backup Method |
The method that the Hybrid Workloads agent uses to create virtual machine recovery points for backup. Can be VSS or RCT. |
| Error Message | The error message displayed if the backup operation fails. |
Data Estimation
The Data Estimation section has the following fields:
| Field | Description |
|---|---|
| Source Data Scanned | The amount of data scanned at the source for the backup. |
| # Virtual Disk(s) Changed | The total number of virtual disks that were changed with respect to the previous backup. |
| # Virtual Disk(s) Added | The total number of virtual disks that were added with respect to the previous backup. |
| # Virtual Disk(s) Removed | The total number of virtual disks that were removed with respect to the previous backup. |
| Time Taken for Estimation | The approximate time taken to scan the data. The time taken for estimation does not include network retry time. |
Data Transfer
The Data Transfer section has the following fields:
| Field | Description |
|---|---|
| Data Transferred to Cloud | The incremental data that is directly uploaded to Cloud after deduplication and compression. |
| Data Transferred to CloudCache | The incremental data that is directly uploaded to CloudCache after deduplication and compression. |
| Backup Duration | The total time taken to upload data to Cloud and CloudCache. Backup duration excludes the estimation time, network retry time, and the waiting for retry time. |
| Backup Speed | The rate at which the source data is scanned for backup. |
| Bandwidth Consumed | The bit rate to transfer data to cloud and CloudCache. |
Environment Details
The Environment Details section has the following details:
| Field | Description |
|---|---|
| Disk Read Rate | The bit rate for reading I/O by the agent. The Disk Read Rate is an average of the total data read and the total time taken to read data at various intervals for all drives where data is distributed. For Hyper-V, the Disk Read Rate is the average value across data store(s) where data is spanning. |
| # Network Retries | The number of network retry attempts made within a job session. |
| Network Retry Duration | The total time spent in network retries. It is cumulative of all network session duration. |
Logs
Log files help analyze and troubleshoot issues encountered while performing a task. You can share the logs with Druva Technical Support to aid in issue resolution.
Progress Logs
Displays the progress logs of the job.
Detailed Logs
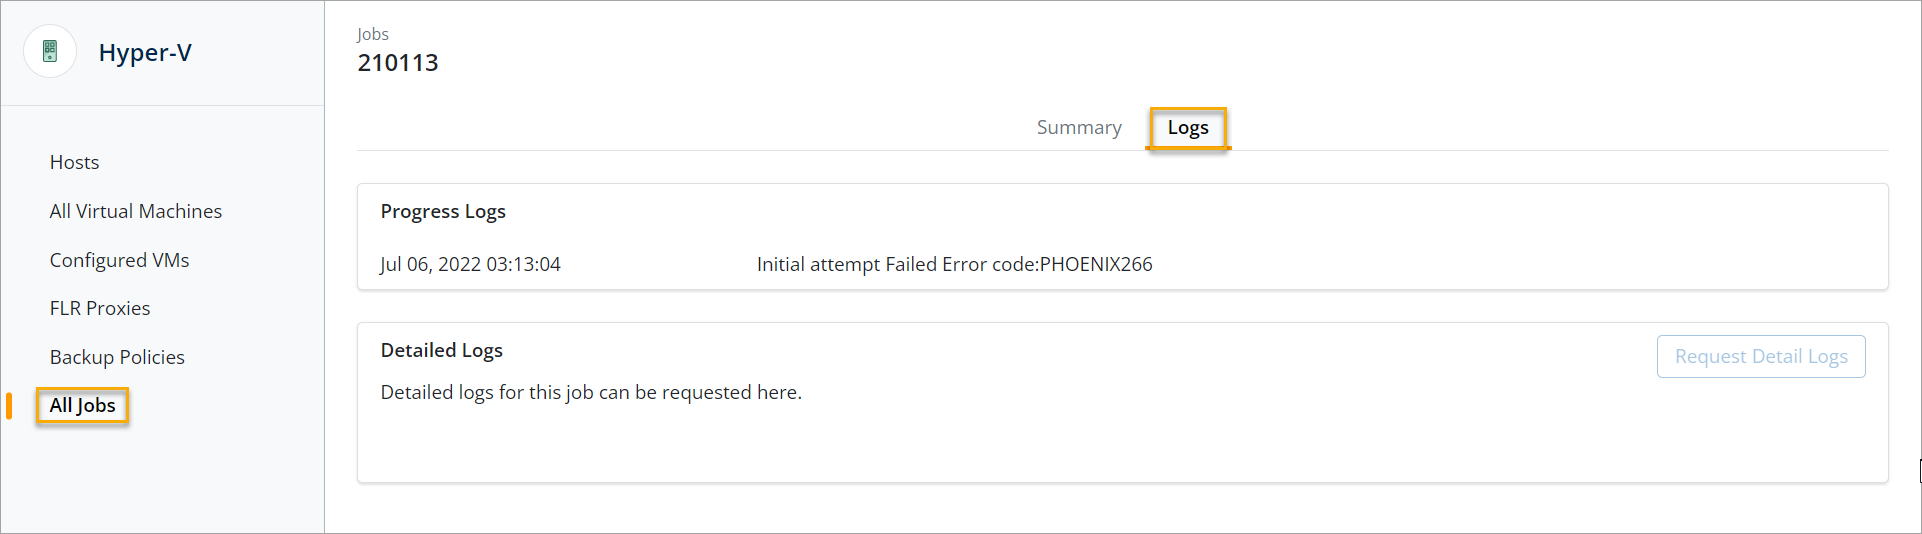
The Detailed Logs section gives you the option to Request Detail Logs. Detailed logs are available only after the upload job completes. Till then, the Request Detail Logs button remains disabled. The logs are available for download till a certain date and time specified under the Available for download till field. The Requested on field shows you when the request for detailed logs was made.
Upload requested logs
The log files are used to analyze and troubleshoot the issues you might encounter while performing a task. For assistance in resolving the issues, you can share the log files with technical support.
Note: Process logs are only available for backup and restore jobs.
Detailed logs for jobs are available for Phoenix agent version 3.4 and later and GovCloud client version 4.0 and later. The detailed logs include the following:
| Common logs for Window, Linux, and backup proxy | Window logs | Linux logs | Backup proxy logs |
|---|---|---|---|
| Druva Phoenix Config | Window event/Application logs | Dmesg logs | VMware logs |
| Agent-specific Logs | VSS information | System information | |
| Main Service logs |
The procedure varies depending on the Phoenix agent version you are using. If a job is executed with Phoenix agent version 3.4 to 4.5, then the Request Server Logs option will fetch the consolidated job logs available for that server. However, if a job is executed with Phoenix agent version 4.6 and later, the Request Job Logs option will fetch logs only for that particular job. You can request job logs within 30 days of triggering the job. You must download the requested logs within 7 days of triggering the request. The job details are available on the Management Console only for 180 days.
Note: If you execute a job on Phoenix agent 4.5 or earlier and then upgrade Phoenix agent to version 4.6 or later before downloading the logs, you will see the Request Job Logs option on the Detailed Logs tab of the Job Details page. However, clicking this button will still fetch the server logs for the job executed before the client upgrade.
You can request job logs within 30 days of triggering the job. You must download the requested logs within 7 days of triggering the request.If the log file is 4.5 MB or smaller, you can send it to technical support as an email attachment. If the log file exceeds 4.5 MB in size, perform the following tasks to send the logs to support:
- Go to https://upload.druva.com/
- Enter the case number in the Ticket Number field.
- Click Choose File, and add the compressed files to upload.
- Click Upload. Notify the support engineer that the logs have been uploaded on the portal by responding to the ongoing support ticket email.