Monitoring VMware jobs
 Business Enterprise Elite
Jobs
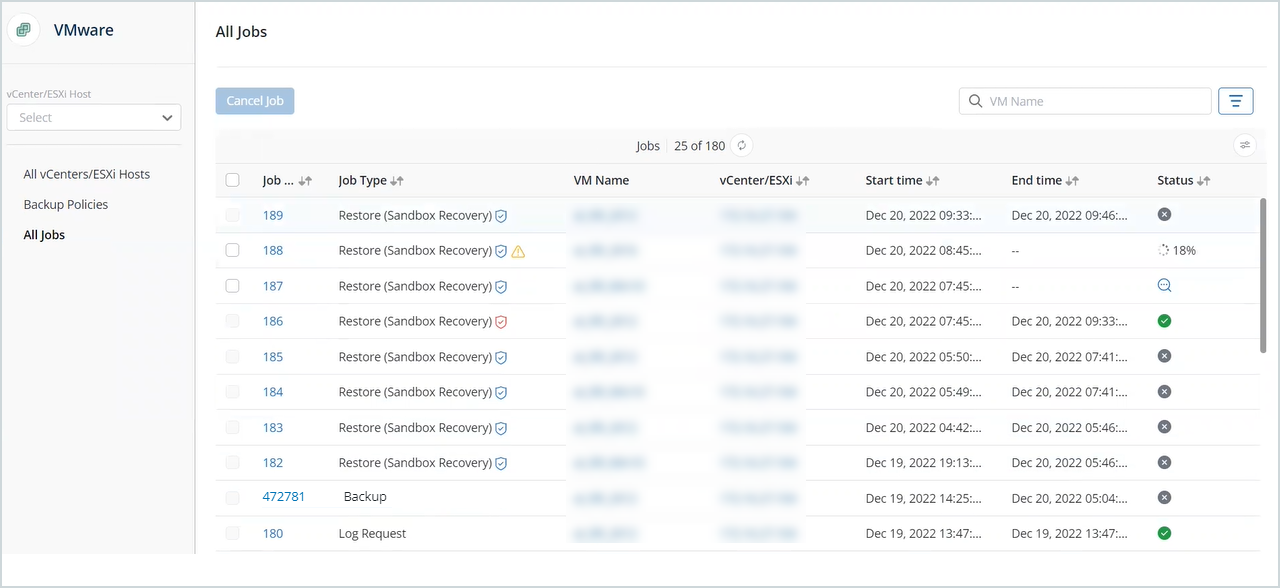
The Jobs page within the Protect > VMware page in the Management Console displays a list of all backup, restore, instant restore, migrate to production, log request, and backup proxy deployment jobs. The Jobs page shows the progress of each VMware job. Job details are available for all jobs. In the job details page you can see the job details and the logs.
To access the VMware Jobs page, perform the following tasks:
- In the left navigation pane, click All Jobs.
The following table lists the fields on the Jobs page.
| Field | Description |
|---|---|
|
Job ID |
A unique identification number associated with the job. Click on the job ID to view the job details. For more information, see View job summary. You can also view the logs of each job. For more information, see View job logs. |
|
Job Type |
The type of job operation, such as Backup, Restore, Restore (Instant restore), Restore (Migrate to Production), Log Request, and Backup Proxy Deployment. You can also filter the jobs based on the type of operation. |
| VM Name | The name of the virtual machine, for which Druva initiates the job. |
|
vCenter/ESXi |
The name of vCenter/ESXi on which the virtual machine resides.
|
| Start Time | The time when the job operation starts. |
| End Time | The time when the job operations complete. |
|
Status |
The status of the triggered job.
|
Filters
You can filter jobs by Job Type, vCenter/ESXi, Job Status, and Started in.
Note: You can resize a column on the All Jobs table by dragging it to the desired location.
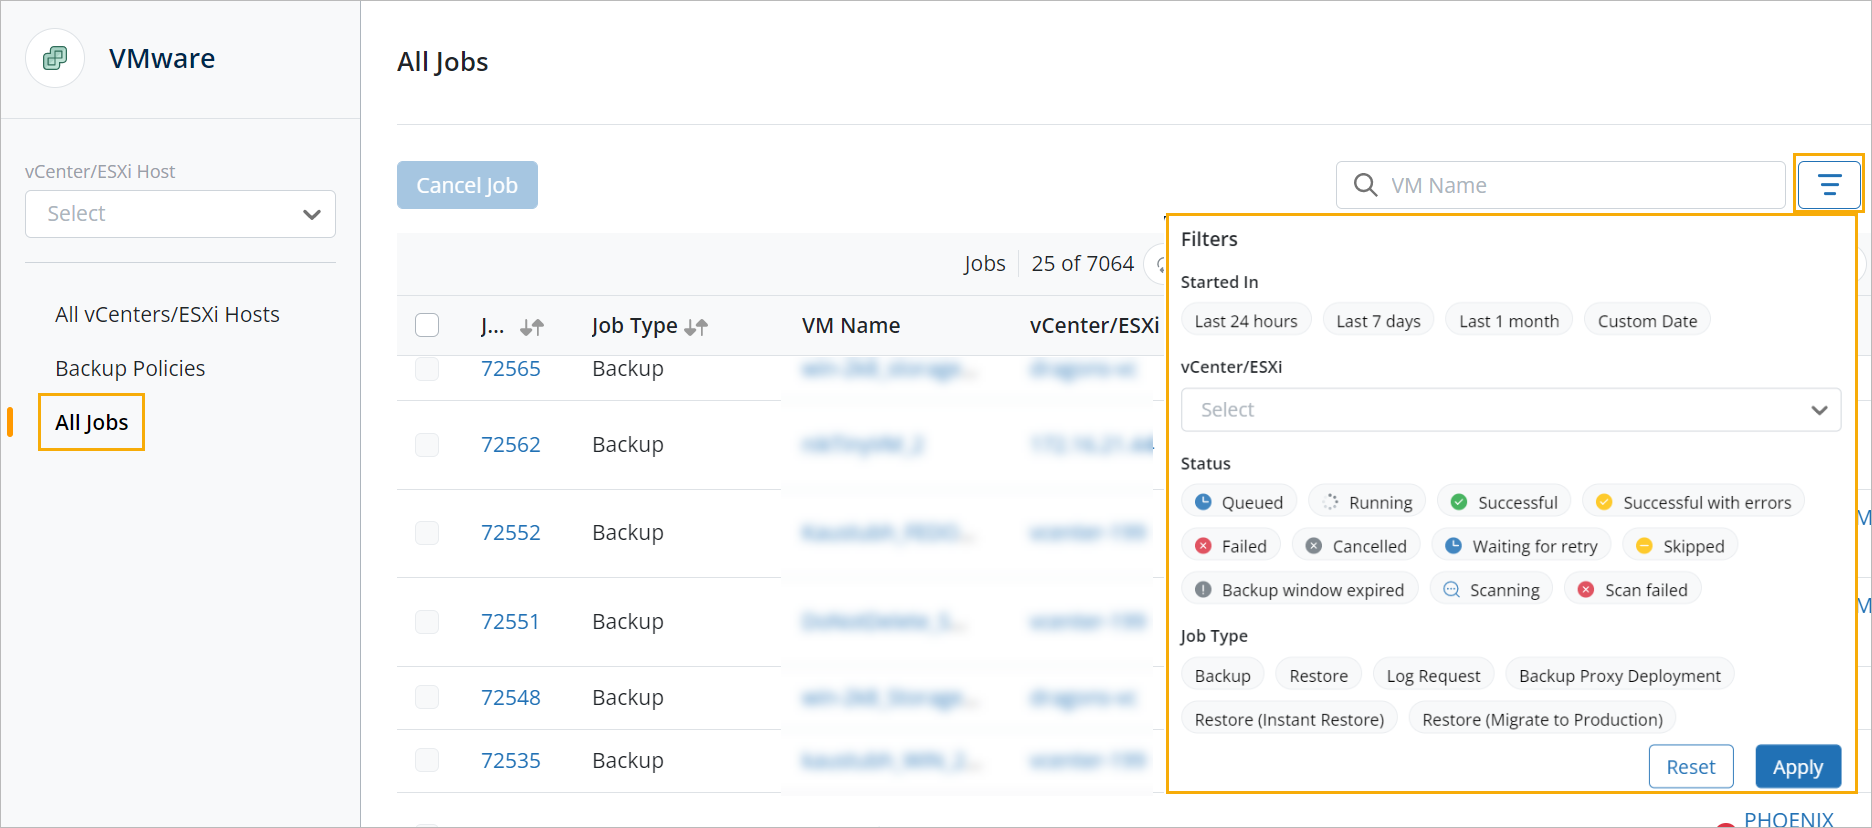
You can filter jobs by the following Job Types:
- Backup
- Restore
- Log Request
- Backup Proxy Deployment
- Restore (Instant Restore)
- Restore (Migrate to Production)
You can filter jobs by the vCenter or ESXi host.
You can filter jobs by Job Status:
- Queued
- Running
- Successful
- Successful with errors
- Failed
- Cancelled
- Waiting for retry
- Skipped
- Backup window expired
- Scanning
- Scan failed
You can filter jobs that Started In the:
- Last 24 hours
- Last 7 days
- Last 1 month
- Custom date
Note: You can choose a specific date range.
The Job ID, VM Name, and vCenter/ESXi values are clickable. Clicking the Job ID value for a VMware job takes you to the job details page. Clicking the value in the VM Name, or vCenter/ESXi column takes you to the Configured VMs or All Virtual Machines page.
From the Jobs page within the Protect > VMware page, click the Job ID of the job whose details you want to view. The jobs details page is divided into the Summary tab and the Logs tab.
Scan status for sandbox recovery job
The following icons are displayed for a sandbox recovery job on the Jobs page. For more information on sandbox recovery and its success and failure scenarios, see Restore virtual machines using sandbox.
| Icon | Text | Description |
|---|---|---|
 |
No malicious file found | This icon is displayed when the restore job and scan are completed successfully and no malicious files are found during the scan. |
 |
Malicious file scan enabled | This icon is displayed for all sandbox recovery jobs when the job is created and remains till the scanning is complete after the successful restore. |
 |
Malicious file found | This icon is displayed when the restore job and scan are completed successfully, but malicious files are found in the scan job. |
Customize table columns
You can customize the table columns using the Customize Table Columns icon.
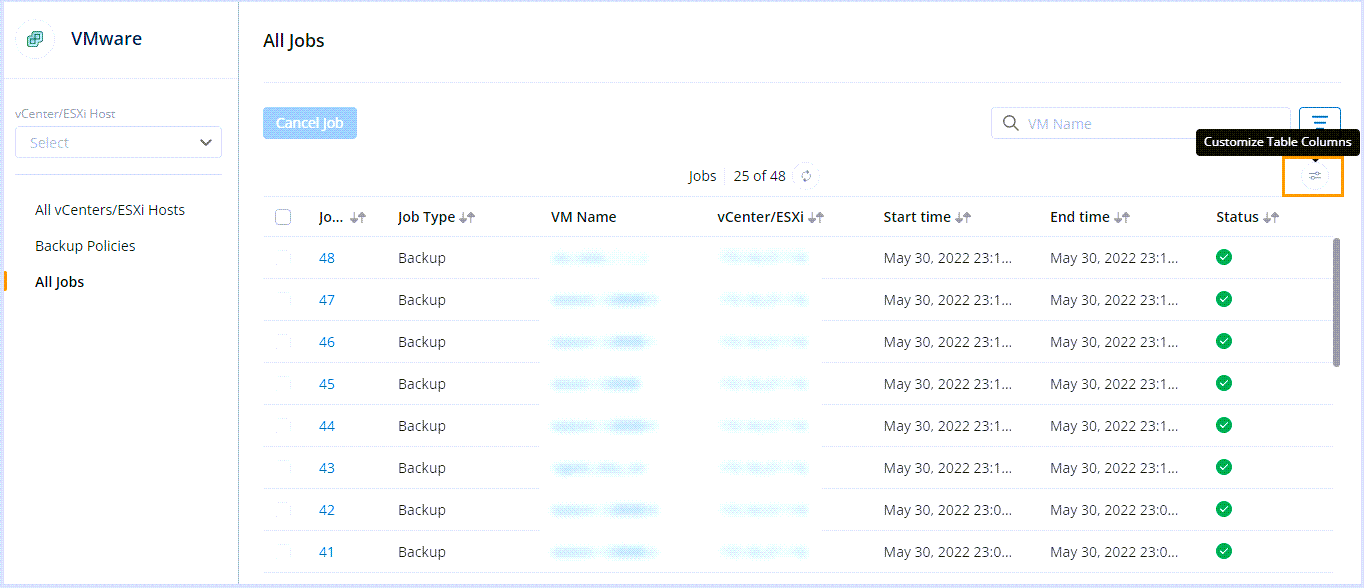
You can click the Customize Table Columns icon to get a list of all the columns on the page:
- Select the checkbox to display the column.
- Clear the checkbox to hide a column on the All Jobs table. Removing unnecessary columns will make the UI more spacious.
- Move a column to change the order. The change is reflected in the All Jobs table.
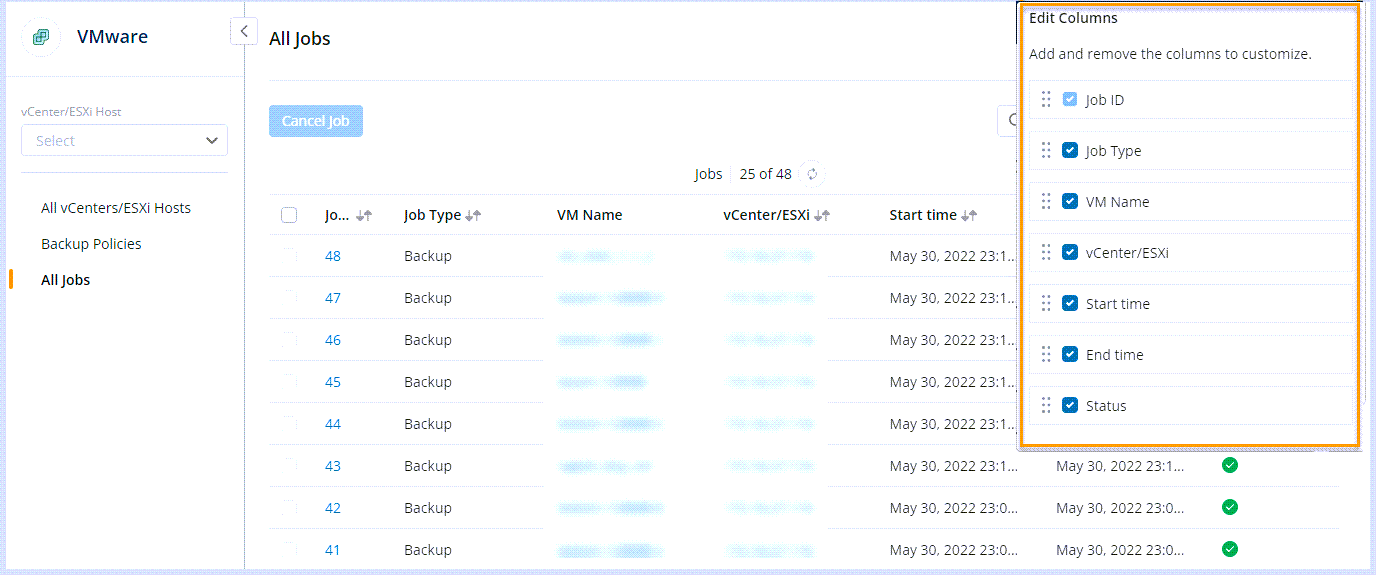
The column configuration persists across sessions in the same browser.
View job summary
- In the left navigation pane, click All Jobs.
- Click on the Job ID and click on the Summary tab. Based on the type of the operation, the job summary is displayed.
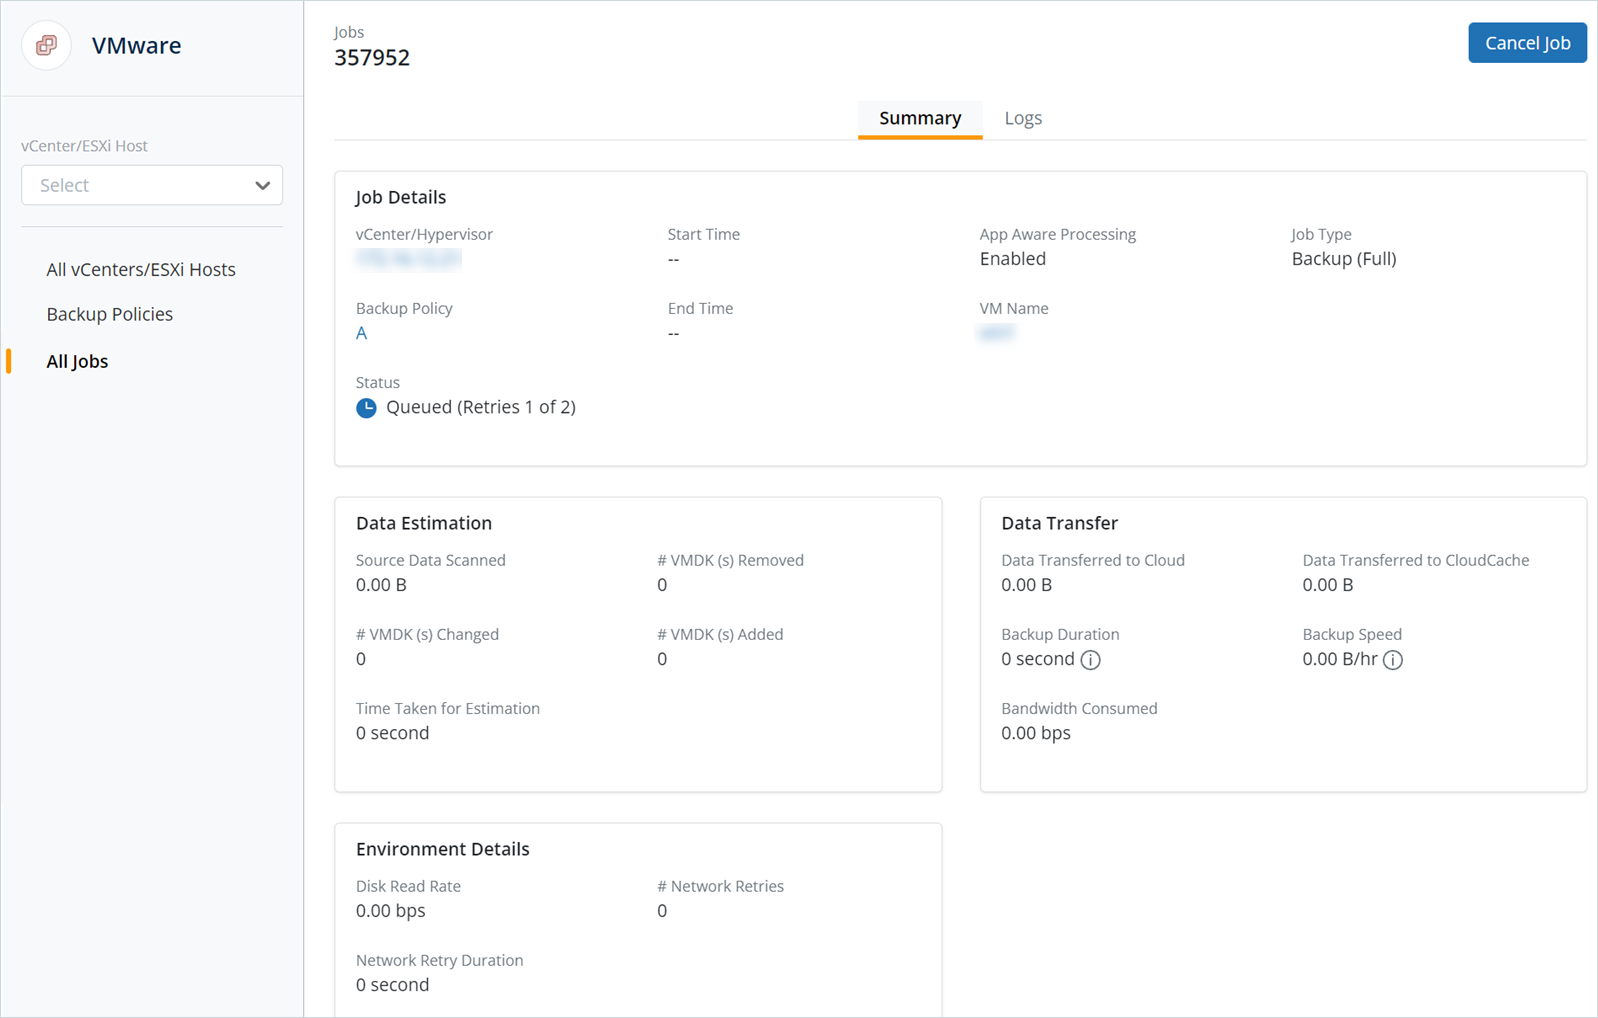
Backup job summary
| Field | Description |
|---|---|
| Job ID | The unique identification number associated with the job. |
| Job Type | The type of operation. For a backup job, the Job Type field displays Backup. |
| VM Name | The virtual machine that initiated the backup. |
| vCenter/Hypervisor | The vCenter/Hypervisor on which the virtual machine resides. |
| Backup Policy | The backup policy associated with the server or virtual machine. |
| App Aware Processing | Indicates if application aware backup was taken for the MS SQL database. |
| Backup Proxy used for job | The backup proxy used by the backup job. |
| Start Time | The time when the backup operation started. |
| End Time | The time when the backup operation finished. |
| CBT Status | Indicates if CBT is enabled. |
| Status |
After the estimation is completed, the percentage of data uploaded to the cloud is displayed.
|
| Error Code | The error code displayed if the backup operation fails. You can click the error code to open the troubleshooting documentation. |
| Error Message | The error message displayed if the backup operation fails. |
| Data Estimation | |
| Source Data Scanned | The scanned source data in order to backup. |
| # VMDK(s) Changed |
The total number of virtual machine disks (VMDKs) that were changed with respect to the previous backup. |
| # VMDK(s) Removed | The total number of virtual machine disks (VMDKs) that were removed with respect to the previous backup. |
| # VMDK(s) Added | The total number of virtual machine disks (VMDKs) that were added with respect to the previous backup. |
| Time Taken for Estimation | The approximate time taken to scan the data. The time taken for estimation does not include network retry time. |
| Data Transfer | |
| Data Transferred to Cloud | The data that is directly uploaded to Cloud after deduplication and compression. |
| Data Transferred to CloudCache | The incremental data that is directly uploaded to CloudCache after deduplication and compression. |
| Backup Duration | The total time taken to upload data to Cloud and CloudCache. Backup duration excludes the estimation time, network retry time, and the waiting for retry time. |
| Backup Speed | The ratio of source data scanned and uploaded to the backup duration. |
| Bandwidth Consumed | The bit rate to transfer data to cloud and CloudCache. |
| Environment Details | |
| Disk Read Rate |
The bit rate for reading I/O by the agent. The Disk Read Rate is an average of the total data read with respect to the total time taken to read data at various intervals for all drives where data is distributed. For VMware, the Disk Read Rate is the average value across data store(s) where data is spanning. |
| # Network Retries | The number of network retry attempts made within a job session. |
| Network Retry Duration | The total time spent in the network retries. It represents the cumulative of all network disconnection duration. |
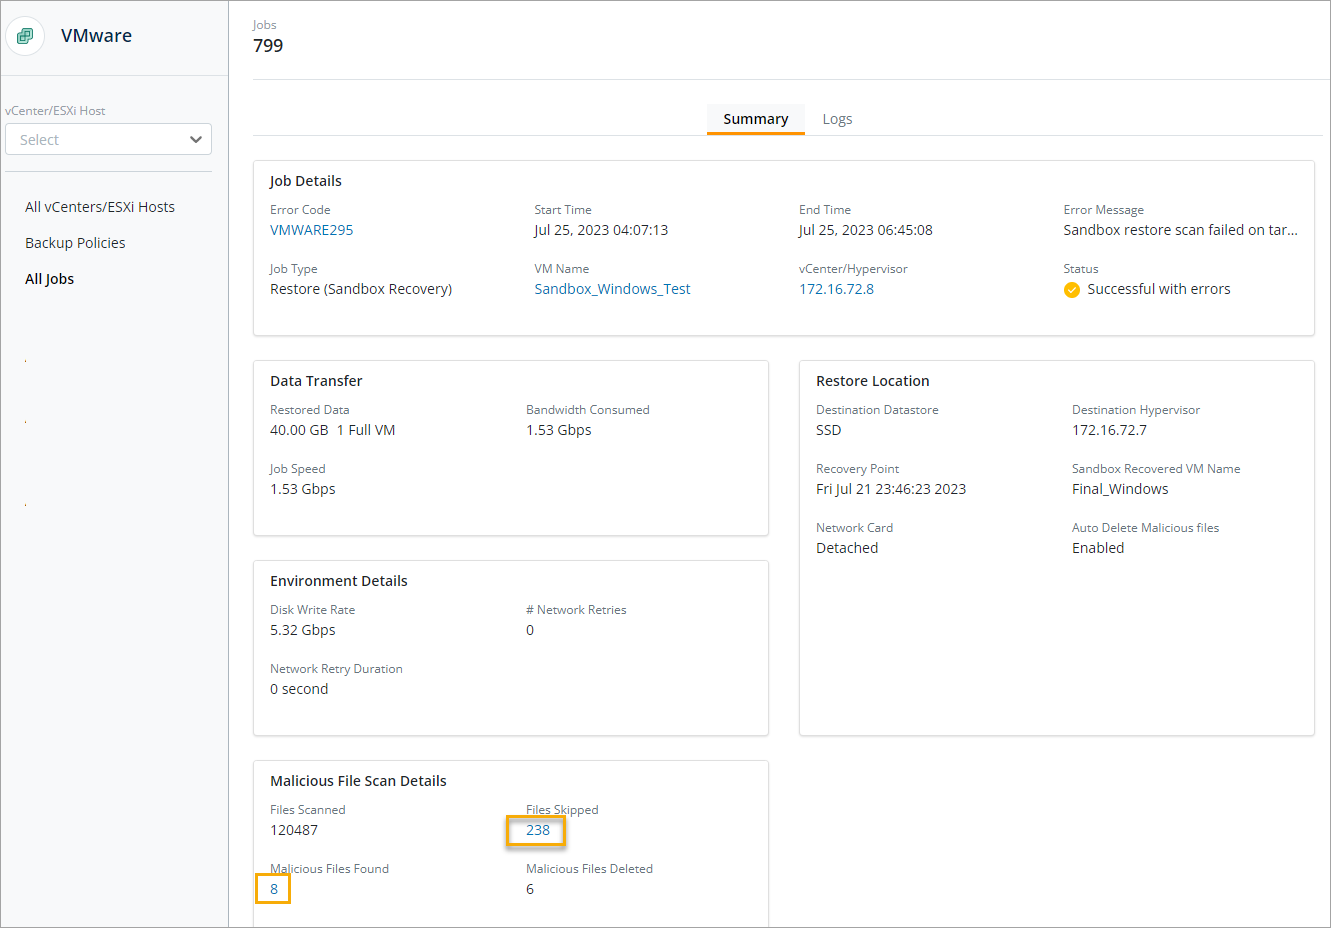
Restore job summary
The following table lists the details displayed on the Job Details page.
| Field | Description |
|---|---|
| Job ID | A unique identification number associated with the job. |
| Job Type |
The type of operation. For the restore job, the Job Type field displays Restore, Restore (MS-SQL- Recovery point), Restore (MS-SQL- Transaction Mark), Restore (MS-SQL- Point in Time), and Restore (Sandbox Recovery).
|
| VM Name | The server or virtual machine on which a restore is initiated. |
| vCenter/Hypervisor | The vCenter/Hypervisor on which the virtual machine resides. |
| Backup Proxy used for job | The Backup Proxy used by the restore job. |
| Start Time | The time when the restore starts. |
| End Time | The time when the restore operation completes. |
| Status | The status of the restore operation. |
| Error Code | The error code of the failed restore operation. You can click the error code to open the troubleshooting documentation. |
| Error Message | The error message displayed if the restore operation fails. |
| Restore Location | |
| Recovery point | The recovery point used to restore. |
| Destination VMware setup | The name of the virtual machine to restore data. |
|
Destination Hypervisor |
The location of the destination hypervisor to restore data. |
| After Restore, maintain database in | The recovery mode in which the MS-SQL databases need to be maintained once the recovery is complete. If the databases are left in the Recovery mode, you cannot perform any further restores. The databases are accessible to users post the restore. If the databases are left in the Non Recovery mode, you can perform further restores. The databases are inaccessible to users until the final restore. |
| MS-SQL Instances | The name of the instance you want to restore. |
| Staging VM | The name of the staging VM used for restore. |
| Target Instance | The name of the restore target instance. |
| MDF, LDF, NDF Location | The location where you want to restore the files. |
| Point in Time (Specified) | The point in time from when the data is restored. |
| Transaction Mark | The transaction mark from when the data is restored. |
| Restore Type | In case of restore from transaction mark, specifies if the restore must exclude or include the marked transaction in the restore job. |
| Data Transfer | |
| Restored Data | The total amount of data restored. |
| Job Speed | The rate at which the data is restored. The restore speed is specified in GB/Hr. |
| Bandwidth Consumed | The bit rate to transfer data from cloud and CloudCache. |
| Environment Details | |
| Disk Write Rate | The bit rate for writing I/O by the agent. The Disk Write Rate is the average of the total data written with respect to the total time taken to write data at various intervals. |
| # Network Retries | The number of network retry attempts made within a job session. |
| Network Retry Duration | The total time spent in the network retries. It represents the cumulative of all network session duration. |
| Malicious File Scan Details If VMware Tools is not installed, a warning message is displayed in the Malicious File Scan Details card. |
|
|
Files Scanned |
Number of files scanned for ransomware.
Click the numeric value indicating the number of files that were skipped during the scan to get the file details. For more information, see File Details. |
| Files Skipped | Number of files that were not scanned due to the following reasons:
|
| Malicious Files Found | Number of malicious files found during the scan. Click the numeric value indicating the number of files that were skipped during the scan to get the file details. For more information, see File Details. |
| Malicious Files Deleted | Number of malicious files deleted after the scan. For more information, see File Details. |
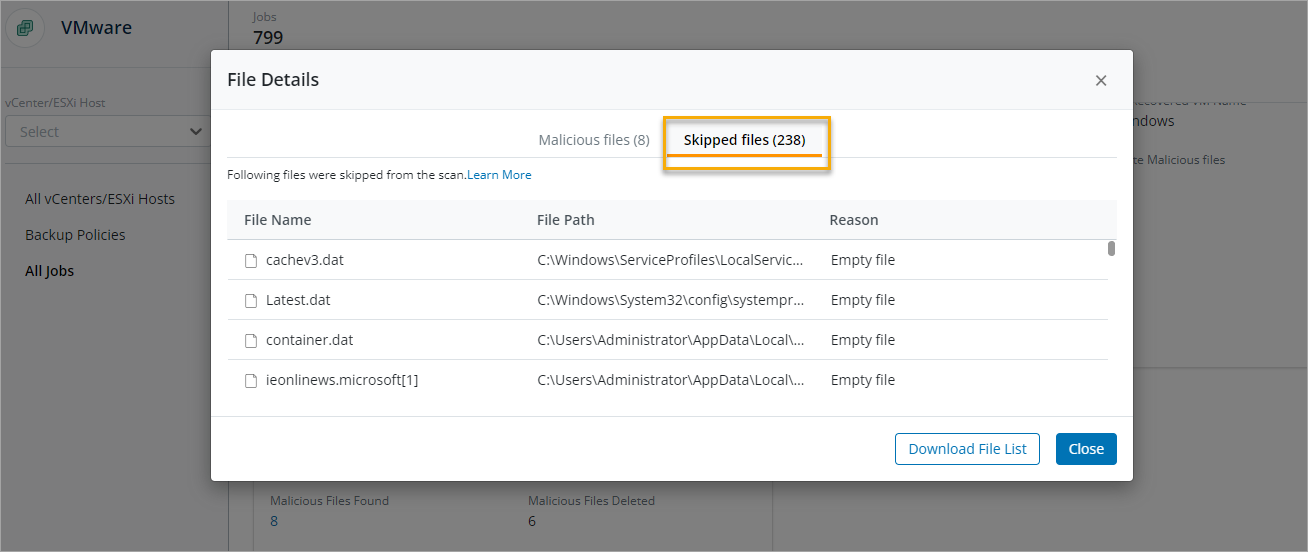
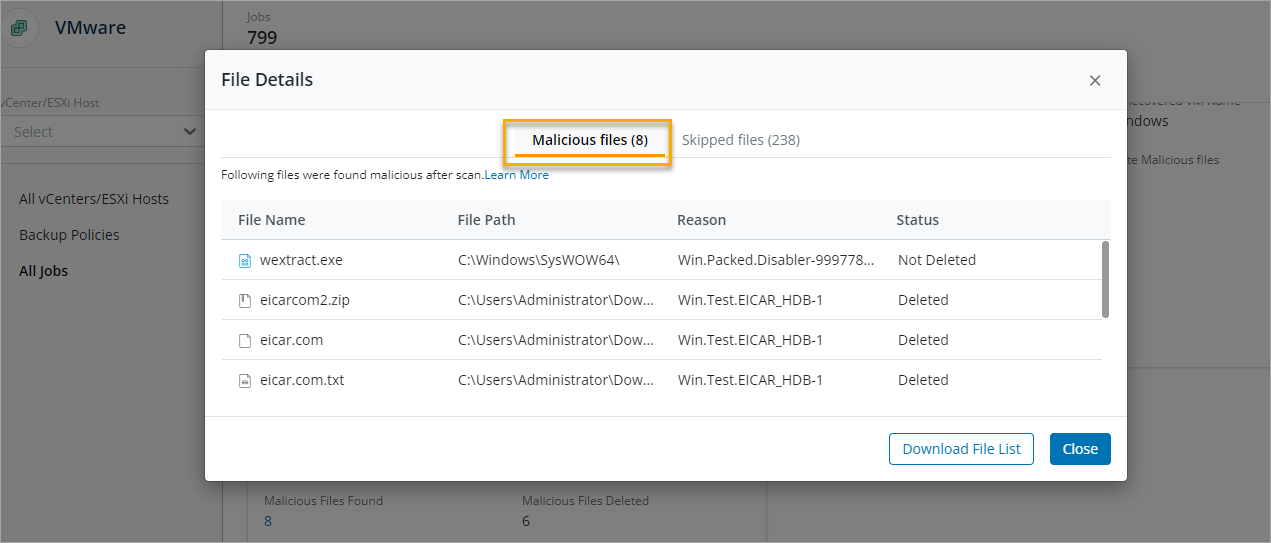
File Details
The following table lists the file details when you click the numeric value indicating the number of files skipped during the scan, malicious files found, and malicious files deleted on the Jobs Summary page.
| Field | Description |
|---|---|
| File Name | Name of the file skipped from the scan or found malicious after the scan. |
| File Path | Location of the above file. |
| Reason | The reason why the file was skipped from the scan or found malicious after the scan. |
| Status | Status if the malicious file is deleted or not. The values are Deleted or Not Deleted. This column is only displayed in the Malicious files tab. |
You can click the Skipped files tab to view the details of the files skipped from the scan.
Click Close to close the window. Click Download File List to download a list of files in .csv format.
You can click the Malicious files tab to view the details of the malicious files after the scan. Click Close to close the window. Click Download File List to download a list of files in .csv format.
Restore (Instant Restore) job summary
The following table lists the details of the Restore (Instant Restore) job:
| Tab | Field | Description |
|---|---|---|
| Summary | Job ID | A unique identification number associated with the job. |
| Job Type | The type of operation. For the instant restore job, the Job Type field displays Restore (Instant Restore). | |
| VM Name | The server or virtual machine on which an instant restore is initiated. | |
| vCenter/Hypervisor | The vCenter/Hypervisor on which the virtual machine resides. | |
| Destination Datastore | The datastore where the virtual machine is restored. | |
| Start Time | The time when the instant restore starts. | |
| End Time | The time when the instant restore operation completes. | |
| Local Storage | The CloudCache to which the virtual machine is mapped for backup. | |
| Status | The status of the Instant Restore operation. | |
| Error Code | The error code of the failed instant restore operation. Click the error code to open the troubleshooting documentation. | |
| Error Message | The error message displayed if the instant restore operation fails. | |
| Restore Location | ||
| Destination Hypervisor | The ESXi hypervisor where the virtual machine is restored. | |
| Recovery point | The Hot recovery point used for Instant Restore. | |
| Instant Recovered VM Name | Name of the instantly restored virtual machine. | |
| Logs | Progress Logs | Displays the progress logs of the instant restore operation for a job. |
| Detailed Logs | The detailed logs for the instant restore operation of that job. You can download the detailed logs for the job using the Request Log Jobs button. For more information, see Logs. | |
Restore (Migrate to Production) job summary
The following table lists the details of the Restore (Migrate to Production) job:
| Tab | Field | Description |
|---|---|---|
| Summary | Job ID | A unique identification number associated with the job. |
| Job Type | The type of operation. For the instant restore job, the Job Type field displays Restore (Migrate to Production). | |
| Backup Proxy used for job | The Backup Proxy used by the migration job. | |
| vCenter/Hypervisor | The vCenter/Hypervisor on which the virtual machine resides. | |
| Destination Datastore | The datastore where the virtual machine is migrated. | |
| Start Time | The time when the migration to production starts. | |
| End Time | The time when the migration to production completes. | |
| Local Storage | The CloudCache to which the virtual machine is mapped for backup. | |
| Status | The status of the Migrate to Production operation. | |
| Error Code | The error code of the failed migration to production operation. Click the error code to open the troubleshooting documentation. | |
| Error Message | The error message displayed if the migration to production operation fails. | |
| Restore Location | ||
| Destination Hypervisor | The ESXi hypervisor where the virtual machine is migrated. | |
| Recovery point | The Hot recovery point used for Instant Restore. | |
| Instant Recovered VM Name | Name of the instantly restored virtual machine. | |
| Logs | Progress Logs | Displays the progress logs of the migration to production operation for a job. |
| Detailed Logs | The detailed logs for the migration to production operation of that job. You can download the detailed logs for the job using the Request Log Jobs button. For more information, see Logs. | |
Log Request job summary
The following table lists the details displayed on the Job Details page.
| Field | Description |
|---|---|
| Job ID | A unique identification number associated with the job. |
| Job Type | The type of operation. For log request job, the Job Type field displays Log Request. |
| VM Name | The name of the virtual machine for which the log is requested. |
| vCenter/Hypervisor | The vCenter/Hypervisor to which the virtual machine belongs to. |
| Job ID for requested logs | The job identification number for which the log request is generated. |
| Start Time | The time when the log request initiates. |
| End Time | The time when the log request completes. |
|
Status |
The status of the log request.
|
| Log Size | The size of the extracted log files. |
| Logs | The time of log request with the option to download log files. |
| Error Message | The error message displayed if the log request operation fails. |
Backup proxy deployment job summary
The following table lists the details displayed on the Job Details page.
| Field | Description |
|---|---|
| Job ID | The unique identification number associated with the job. |
| Job Type | The type of operation. For a proxy deployment job, the Job Type field displays Backup Proxy Deployment. |
| vCenter/ESXi | The vCenter/ESXi on which the backup proxy is deployed. |
| Datacenter | The datacenter the backup proxy pools and the vCenter/ESXi is part of. |
| Backup Proxy Pool used for job | The backup proxy pool the backup proxy will be added to. |
| Start Time | The time when the deployment operation starts. |
| End Time | The time when the deployment operation completes. |
| Backup Proxy Deployed | Current status of the number of backup proxies deployed |
| Backup proxy used for job | Backup proxy used for deployment of additional backup proxy. |
| Status |
The status of the deployment job. The status can be one of the following:
|
| Backup proxy details | |
| Backup Proxy Name | Name of the backup proxy that is being deployed. |
| ESXi Host | The ESXi host on which the backup proxy is deployed. |
| Datastore | The datastore to which the backup proxy is deployed |
| IP Address | IP address of the backup proxy. |
| Status |
Following statuses are displayed for each proxy:
|
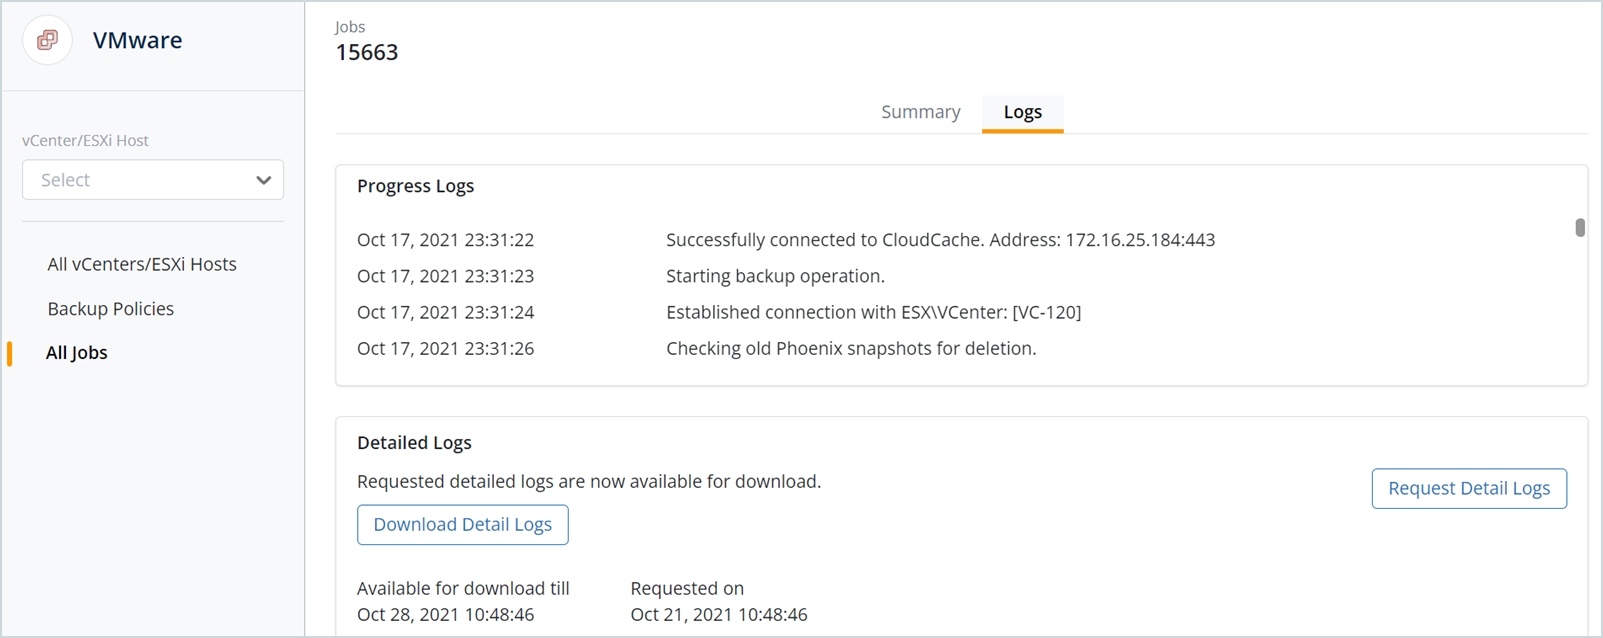
View job logs
The Logs page displays the following information in each section:
| Section | Description |
|---|---|
| Progress Logs |
Displays the progress logs for the selected job.
|
| Detailed Logs |
The detailed logs for the selected job. You can download the logs within seven days of the request.
|
By default, Druva displays the timestamps for each job following the administrator time zone. If you set a time zone when updating your account details, the timestamps follow the changed time zone. Both system and progress logs will follow the administrator's time zone.
- In the left navigation pane, click All Jobs.
- Click on the Job ID and click on the Logs tab.
- You can view the progress logs of the respective operation for a job.
- To download the detailed logs for the job, click Request Log Jobs.
- After you receive an email, the Download Detailed log button is activated. Click the button to download the log zip file.
Note: The debug logs on the VMware backup proxy contain IP addresses of all hops between your VMware backup proxy and Druva Cloud. This information is recorded solely for troubleshooting purposes.
Upload requested logs
The log files are used to analyze and troubleshoot the issues you might encounter while performing a task. For assistance in resolving the issues, you can share the log files with technical support.
Note: Process logs are only available for backup and restore jobs.
The detailed logs include the following:
| Common logs for Window, Linux, and backup proxy | Window logs | Linux logs | Backup proxy logs |
|---|---|---|---|
| Druva Phoenix Config | Window event/Application logs | Dmesg logs | VMware logs |
| Agent-specific Logs | VSS information | System information | |
| Main Service logs |
You can request job logs within 30 days of triggering the job. You must download the requested logs within 7 days of triggering the request.If the log file is 4.5 MB or smaller, you can send it to technical support as an email attachment. If the log file exceeds 4.5 MB in size, perform the following tasks to send the logs to support:
- Go to https://upload.druva.com/
- Enter the case number in the Ticket Number field.
- Click Choose File, and add the compressed files to upload.
- Click Upload. Notify the support engineer that the logs have been uploaded on the portal by responding to the ongoing support ticket email.