socket error while create_connection with Error 10060
This article applies to:
- Product edition: Phoenix Cloud
- Feature Category: Phoenix File Server agent
Problem description
Job logs show socket error (error number 10060) while creating the connection between the client and Phoenix server and cause multiple issues i.e.
- Newly installed Phoenix agent activation getting stuck.
- Phoenix backup job gets stuck and appears as queued on the Phoenix Management Console.
- The Server displays as disconnected on the Phoenix Management console.
Cause
Network issue, possibly related to firewall.
Traceback
[2018-06-01 08:14:50,286] [ERROR] roboSyncer: socket error while create_connection: [Errno 10060] A connection attempt failed because the connected party did not properly respond after a period of time, or established connection failed because connected host has failed to respond!!
error: [Errno 10060] A connection attempt failed because the connected party did not properly respond after a period of time, or established connection failed because connected host has failed to respond.
[2023-01-17 15:59:40,548] [ERROR] Error <class 'socket.error'>:(10060, 'WSAETIMEDOUT'). Traceback -Traceback (most recent call last): 3 File "roboCRoutines.pyc", line 149, in activate 4 File "roboCRoutines.pyc", line 238, in fs_activate
Resolution
- Login to the affected server and check the output of the telnet command. If there is a disconnect, involve the network team.
telnet phoenix.druva.com 443telnet backup-phoenix.druva.com 443telnet notifier-phoenix.druva.com 443- Use nslookup or tracert for these URLs phoenix.druva.com, backup-phoenix.druva.cm, notifier-phoenix.druva.com
- Compare the working server network firewall configuration with the non-working server.
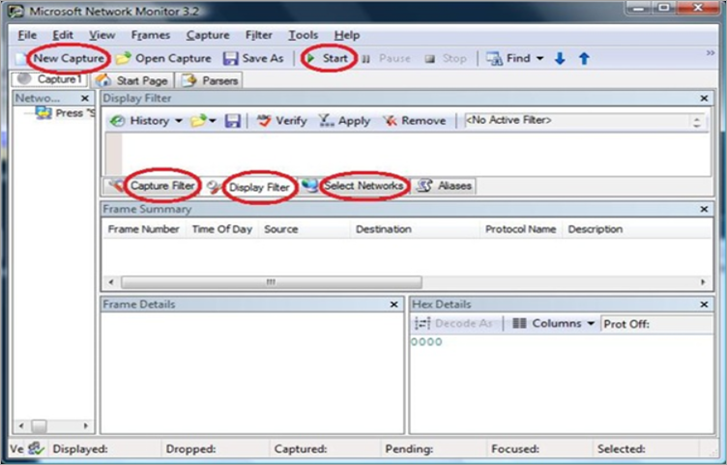
- Install the Microsoft Network Monitor Tool (netmon) over the affected client server.
The installer is available from the How to setup and collect network capture sing Network Monitor tool section. - Open the Microsoft network monitor tool as an administrator.
- Capture the network traces. Refer How to setup and collect network capture sing Network Monitor tool section for more information.
- Use the controls on the Display Filter tab to filter the relevant traffic. Use the tab to specify keywords or expressions to filter the traffic.
For example, to see only HTTP traffic, enter http in the Display Filter text area and click Apply. Use the following controls on the Network Monitor to filter the traffic:- New Capture
- Start
- Capture Filter
- Display Filter
- Select Networks
- Ensure "*.druva.com" is whitelisted from the firewall restrictions.