Disaster Recovery Failback Activity Report
Overview
Disaster Recovery Failback Activity report provides details of the failback jobs triggered for the failed over EC2 instances in the organization. The report includes the following details of each failback job: the identifier of the failback job, the identifier of the instance for which failback is triggered, the name of the source vCenter/ESXi, the date and the timestamp of the start and the completion of each failback operation, the status of the failback operation, the IP address of the destination vCenter/ESXi, the name and the universal unique identifier (UUID) of the recovered virtual machine during failback, and the details of the failback operation.
To address a disaster, Disaster Recovery spins up the AWS EC2 instances from the EBS snapshots during failback. The virtual machines in the AWS account are recovered based on the configuration and failback settings specified in the DR plan. Once Disaster Recovery addresses the disaster, you can failback the EC2 instances with a single click to an alternate location in your virtualization infrastructure without any data loss.
When you trigger failback, the backup proxy creates a target virtual machine in the virtualization infrastructure. The virtual machine then connects to the failed over EC2 instance and the data is copied to the virtual machine. Hybrid Workloads then boots up the virtual machine and launches the target instance. You must configure the virtual machine with the previous backup policy to resume the operations.Note: You can failback the entire DR plan or multiple VM instances in the DR plan by selecting all the required instances in the DR plan at one time for failback.
Procedure
- Log in to the Druva Cloud Platform Console.
- In the Global Navigation Panel > Reports > Hybrid Workloads. The Hybrid Workloads Reports page appears.
- Click Disaster Recovery Failback Activity.
The Disaster Recovery Failback Activity page appears. By default, the report provides details of the alerts that occurred in the last 30 days.
You can apply filters to the report to fetch failback activity alerts details per your requirements. You can view the generated report, download it, or send it through an email to the intended recipients. You can also download data in the widgets in the CSV, CSV-Summary, and PDF formats. You can sort data in the table view using single or multiple columns, and rearrange columns in the table as required.
Note: The report data is refreshed every two hours. The last updated time recorded for the report is displayed next to the report title. This timestamp follows the administrator’s time zone. However, the timestamps of the data fetched in the report follow the UTC time zone.
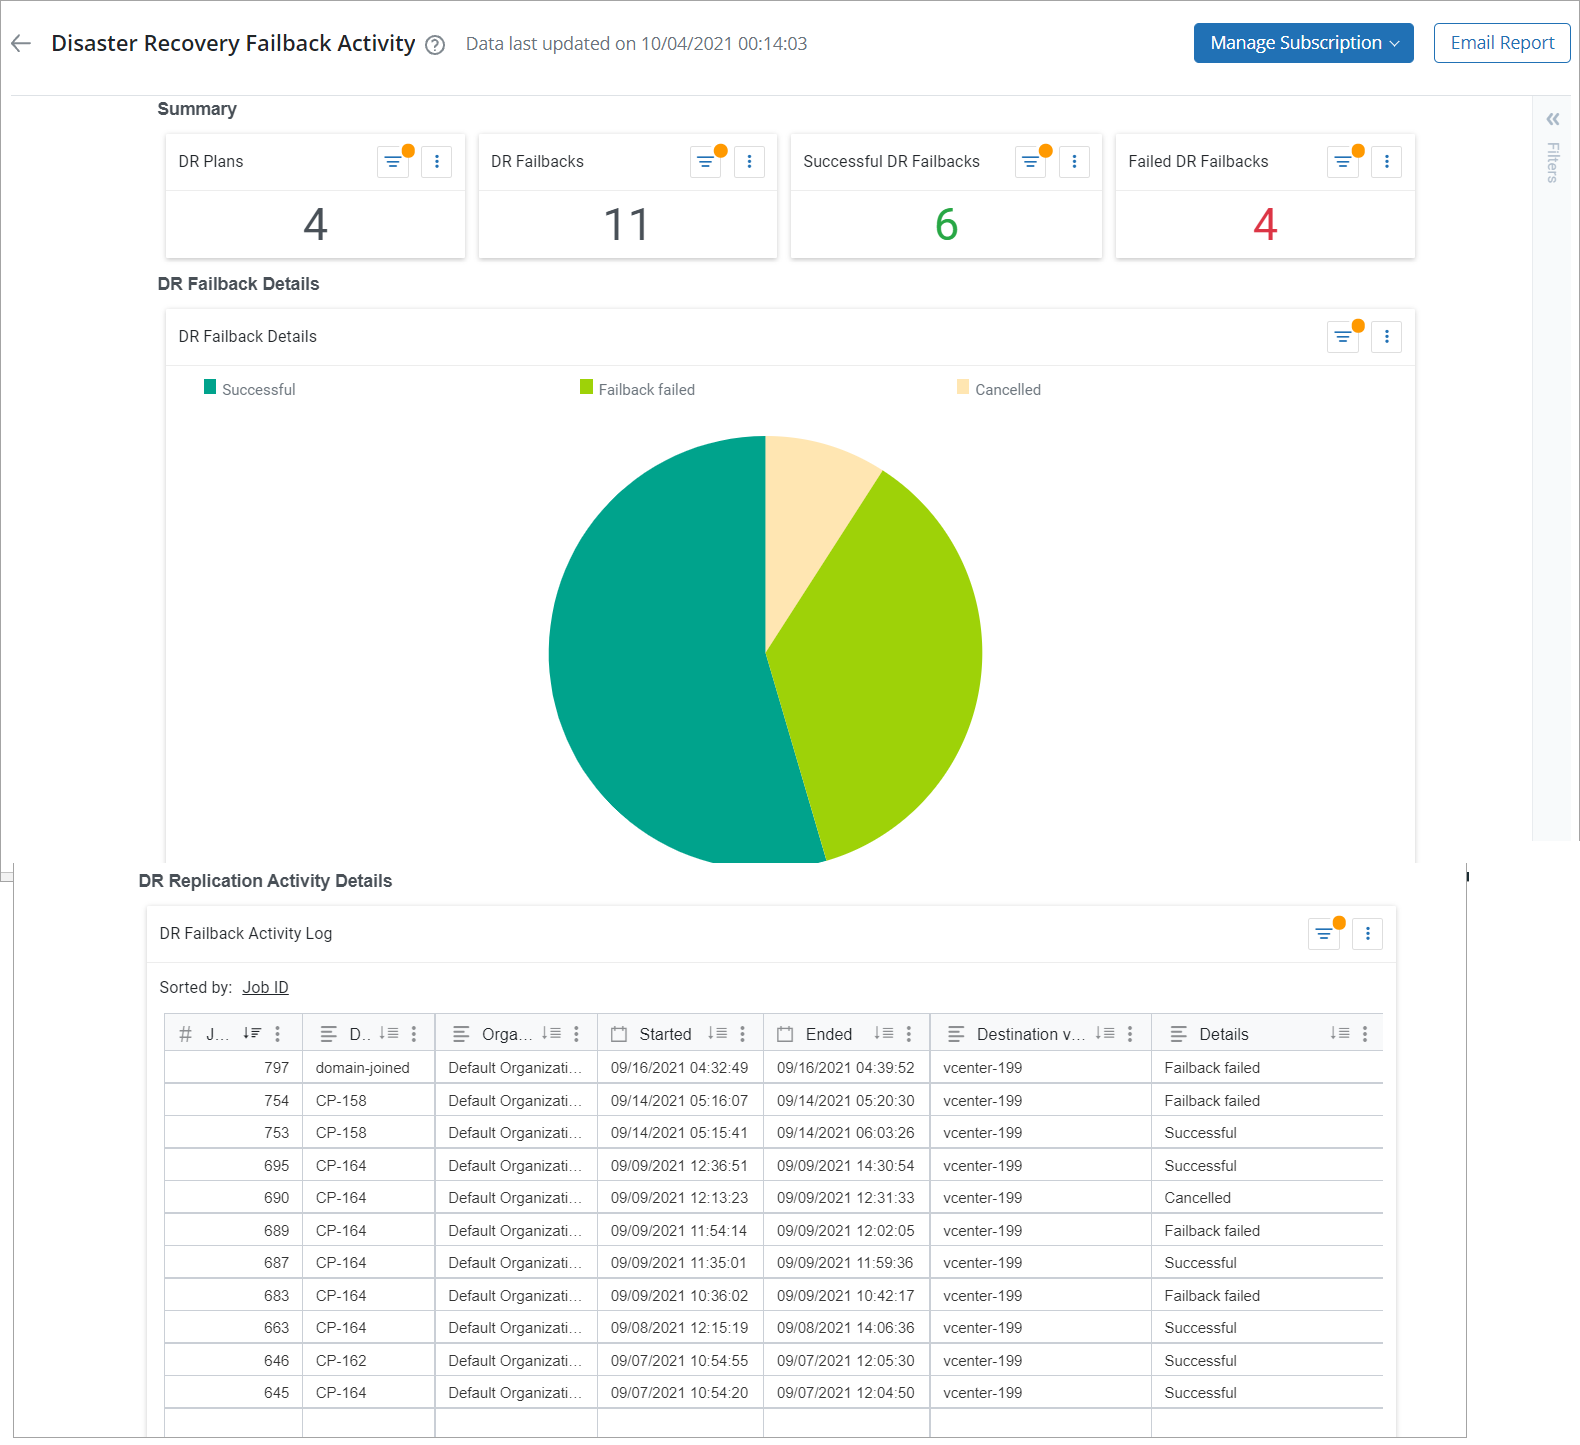
The following screenshot depicts a sample Disaster Recovery Failback Activity report.
The following table lists the fields of the Disaster Recovery Failback Activity report:
| Section | Field | Description |
|---|---|---|
| Summary | DR Plans | The count of the Disaster Recovery Plans that provide restoration and limit damage in disaster recovery scenarios. |
| DR Failbacks | The count of Disaster Recovery Failbacks that transfer critical workloads from primary source to affected systems. | |
| Successful DR Failbacks | The count of successful Disaster Recovery Failbacks. | |
| Unsuccessful DR Failbacks | The count of unsuccessful Disaster Recovery Failbacks. | |
| DR Failback Details | DR Failbacks Job Status | The pie chart displays the total number of Disaster Recovery Failbacks Job Status. For example, Cancelled, Failed, Successful, and N/A status. |
| DR Failback Activity Details | Job ID | The unique identification number of the DR Failbacks job. |
| Organization | The name of the organization in which the workload is configured. | |
| Started | The date and time when the DR Failback first occurred. | |
| Ended | The date and time when the DR Failback ended. | |
| Destination (vCenter/ESXi) |
The destination of the vCenter/ESXi setup where the instance must failback. This list only displays the vCenter/ESXi servers registered with Disaster Recovery. |
|
| Details | The details of the DR Failbacks Job. For example, Cancelled. |
Actions
The following table lists the actions that you can perform on this report page.
| Action | Description |
| Add filter | Creates filters to display Disaster Recovery Failback Activity report based on the filter’s selection. |
| Sort data | Sorts data in the Disaster Recovery Failback Activity table using one or more columns. |
| Rearrange columns | Changes the order of the columns in the Disaster Recovery Failback Activity table. |
Add Filter
Procedure
- On the Disaster Recovery Failback Activity report page, click the filter icon.
The Filters widget appears. The Filters widget displays a Disaster Recovery Failback Activity filter selected by default that lists failback activities performed in the last 30 days. You can define multiple filters based on your requirements. Druva will fetch report data based on the fields’ selection. Click the delete icon to remove filters. - Click Add Filter.
- On the Filter dialog, select a field or type the field name in the Column box, and use the filter options to create a combination of filters, and click Apply.
The Disaster Recovery Failback Activity Report page now displays data specific to the filter created. Similarly, you can further create more filters and apply them to display audit trail details.
For example, to fetch activity details for a specific VM name, select the VM name from the filter options, select the Equals option from the Is drop-down list, and select the name of the virtual machine. - Click Apply.
The report now displays activities performed by the selected administrator.
Sort data
Use the sort options to sort the report data in a single or multiple columns in ascending or descending order.
Multiple-column Sort
The Apply Multiple-column Sort option allows you to sort report data using more than one column. The report data displays based on the order of columns selected.
To sort DR activity by any specific columns, simply perform the following steps:
- In the table view, go to the Started column and click the more Reports icon > Apply Multi-Column Sort option on any column.
- Click the sort icon in the Started column.
- The table displays sorted report data based on the selected order of columns.
Rearrange columns
You can change the sequence of the columns in the Disaster Recovery Failback Activity table, Simply drag a column and drop it to the required position within the table.