Alert History Report
Overview
Druva provides alerts and their severities as an indication of how serious an issue is and, therefore, how promptly it needs to be addressed. The monitoring tools generate alerts to notify Hybrid Workloads administrators of changes, high-risk actions, or failures in the environment. All of these details and actions are captured in the Alert History report. The Alert History report provides alert details based on their severities and types in a pictorial and tabular representation.
There are three types of alerts:
- Info: No remedial action is required.
For example, when a new device is enrolled or an existing device is unenrolled. - Warning: Investigate whether any action is required.
For example, malicious applications are detected on the same device within a short span of time. - Critical: Action is required immediately because the scope of the problem has increased. Investigate critical alerts or events immediately.
For example, the same malware is detected across multiple devices in your environment.
In addition to the above severities, the Alert History report provides you with Resolved and Unresolved alert count. Alert details can be downloaded in PDF, CSV or CSV-Summary formats. You can also email the reports to the intended recipients.
Procedure
- Log in to the Druva Cloud Platform Console.
- Go to the Global Navigation Panel > Reports > Hybrid Workloads. The Hybrid Workloads Reports page appears.
- Click Alert History.
The Alert History page appears. By default, the report provides details of the alerts that occurred in the last 30 days.
You can apply filters to the report to fetch resource alerts data details per your requirements. You can view the generated report, download it, or send it through an email to the intended recipients. You can also download data in the widgets in the CSV, CSV-Summary, and PDF formats. You can sort data in the table view using single or multiple columns, and rearrange columns in the table as required.Note: The report data is refreshed every two hours. The last updated time recorded for the report is displayed next to the report title. This timestamp follows the administrator’s time zone. However, the timestamps of the data fetched in the report follow the UTC time zone.
The following screenshot depicts a sample Alert History report.
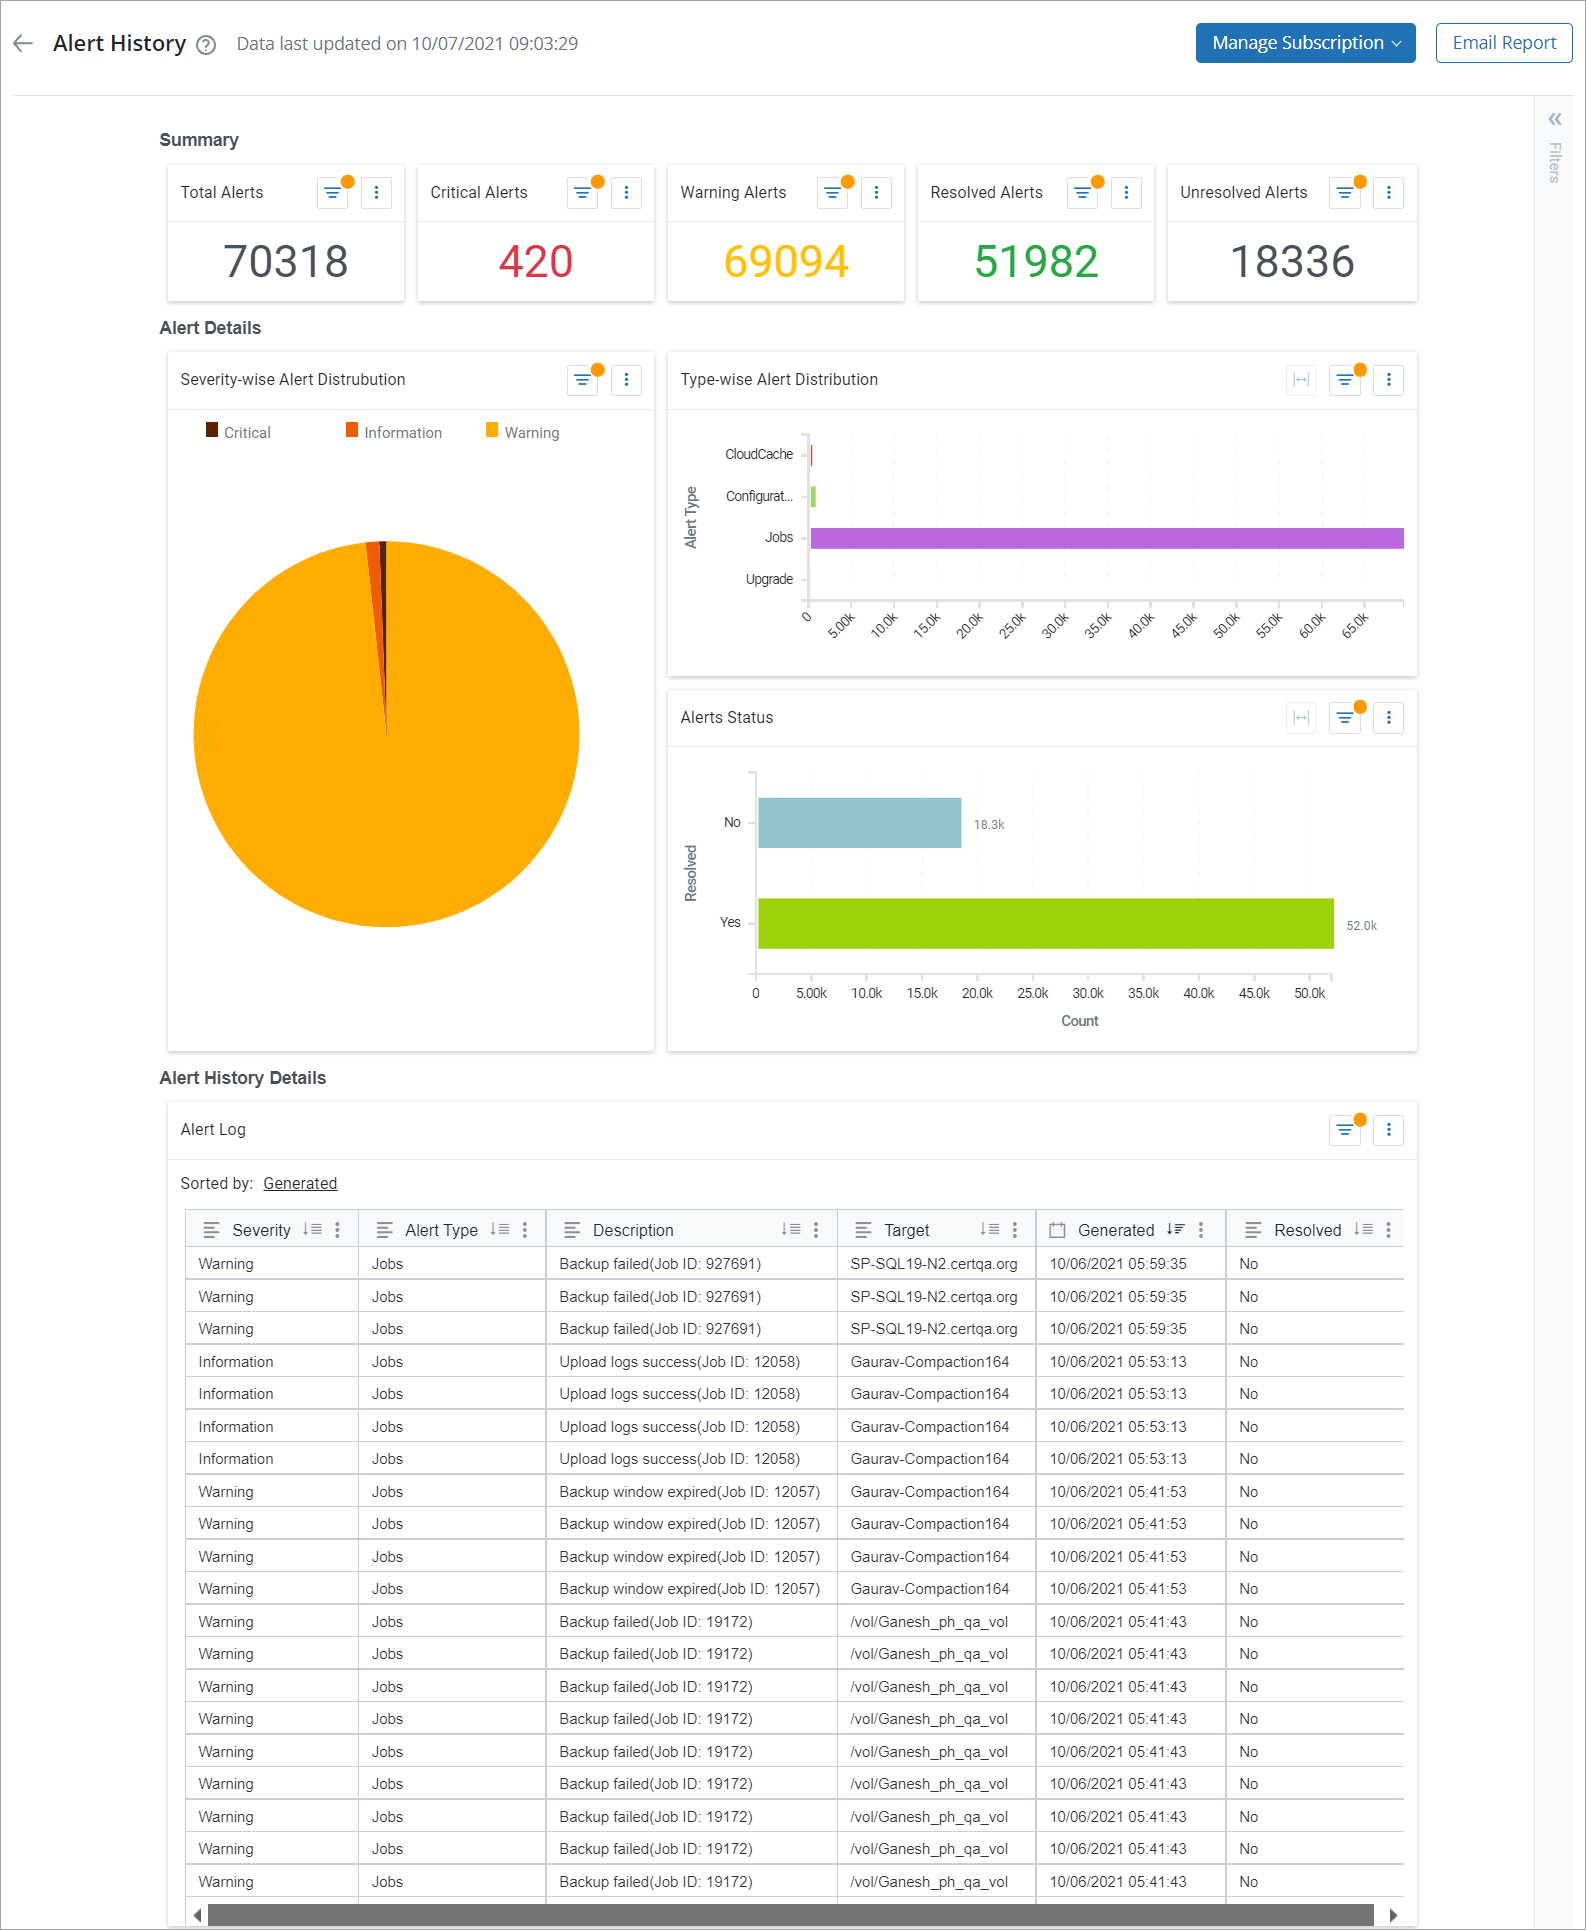
The following table lists the fields of the Alert History report:
| Section | Field | Description |
| Summary | Total Alerts | The total count of the alerts that are generated on the console. |
| Critical | The count of critical alerts generated. | |
| Warning | The count of warnings generated. | |
| Resolved | The count of resolved alerts. | |
| Unresolved | The count of pending alerts, which are active. | |
| Alert Details | Severity-wise Alerts Distribution | The pie chart displays the alerts based on their severity. For example, Critical, Info, and Warning. |
| Type-wise Alerts Distribution | The first horizontal bar graph depicts the Alert Type (Jobs) versus Alert Count data in a pictorial chart. | |
| Alert Status | The second bar graph depicts the count of resolved and unresolved alerts in a pictorial chart. | |
| Alert History Details | Severity | The impact that occurred for a resource or entity. For example, Critical, Info, Warning and others. |
| Alert Type | The type of the alert that occurred. For example, Jobs. | |
| Target | The entity where the alert first occurred. | |
| Description | The details of the generated alert. For example, Backup Failed. | |
| Generated On | The date and time when the alert first occurred. | |
| Resolved | The count of solved alerts. |
Actions
The following table lists the actions that you can perform on this report page.
| Action | Description |
| Add filter | Creates filters to display Alerts History report based on the filter’s selection. |
| Sort data | Sorts data in the Alerts History table using one or more columns. |
| Rearrange columns | Changes the order of the columns in the Alerts History details table. |
Add Filter
You can apply filters to the report to fetch details as per your requirements. You can view the generated report, download it, or send it through an email to the intended recipients.
Procedure
- On the Alerts History report page, click the filter icon.
The Filters widget appears. The Filters widget displays alerts history activity filter selected by default that lists alerts generated in the last 30 days. You can define multiple filters based on your requirements. Druva will fetch report data based on the fields’ selection. Click the delete icon to remove filters.
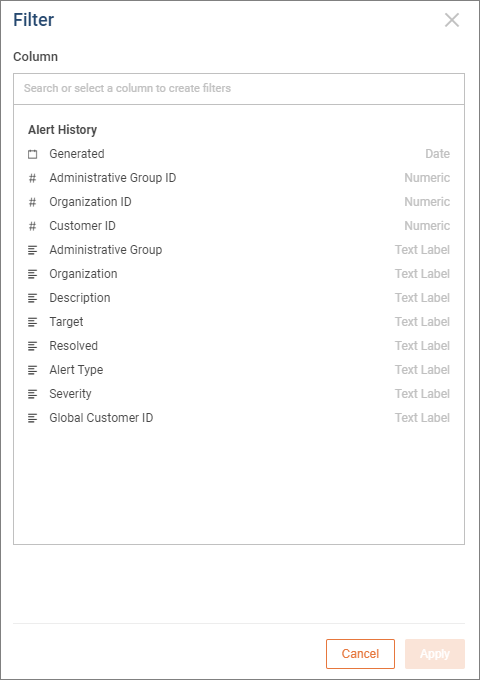
- Click Add Filter.
On the Filter dialog, select a field or type the field name in the Column box, and use the filter options to create a combination of filters, and click Apply.
The report page now displays data specific to the filter created. Similarly, you can further create more filters and apply them to display other activity details.
For example, to fetch alert history for an organization, say Default Organization, select the Organization from the filter options, select the Equals option from the Is drop-down list, and select the Default Organization check box. Click Apply.
The report now displays alert history for Default Organization.
Sort data
Use the sort options to sort the report data in a single or multiple columns in ascending or descending order.
Single-column Sort
-
Click the
icon to sort the data values in an ascending or descending order.
-
Click the
icon to disable the sorting option.
Multiple-column Sort
The Multiple-column Sort option allows you to sort report data using more than one column. The report data displays based on the order of columns selected.
For example, you may want to fetch a list of critical alerts that are pending for resolution. To get this data, simply perform the following steps:
- In the table view, go to the Severity column and click the more
icon > Apply Multi-Column Sort option.
- Click the sort icon in the Resolution column.
The table displays sorted report data based on the selected order of columns.
Rearrange columns
You can change the sequence of the columns in the Alert History table, Simply drag a column and drop it to the required position within the table.