Getting Started With Reports
Purpose
The Druva Cloud Platform Reports provides an intuitive & simplified experience in downloading & managing reports. You can get granular insights into all your product operations through centralized reports.
Note: Only the Endpoints workload-specific reports are available on the Druva Cloud Platform. Reports containing SaaS App workload data include data specific to Endpoints on the Druva Cloud Platform.
Benefits of using Reports
Druva generates a comprehensive set of reports that enable you to perform the following actions:
- Track the day-to-day backup and restore operations.
- Monitor the health status of your workloads deployed on the premises and in the cloud.
- View all administrator data activities ensuring complete transparency, traceability, and accountability of all the administrators.
- Record alerts generated for all the workloads.
- Perform an in-depth analysis of the total credits and storage consumed by your workloads over a duration to address business requirements.
- Determine the storage consumed by specific teams, departments, or remote offices of your organization, assign a dollar value to this storage usage, and forecast the budget.
- Perform periodic audits to analyze business compliance requirements and potential risks faced by the organization.
- Notify your organization of the disaster recovery operations.
- Maintain historical data of your organizations up to two years thereby facilitating you to compare trends for two financial years.
Access Privileges for Endpoints
-
Druva cloud administrator, Cloud administrator, and other administrators with View and download reports and view alerts right can view and download all reports.
-
Druva cloud administrator, Cloud administrator, and other administrators with Change report schedules right can subscribe to all reports, manage subscriptions, and send email reports to other subscribers.
For more information about rights, see predefined roles and rights.
To access the reports
Go to Druva Cloud Platform Console Global left navigation pane> Reports.
View the Reporting page
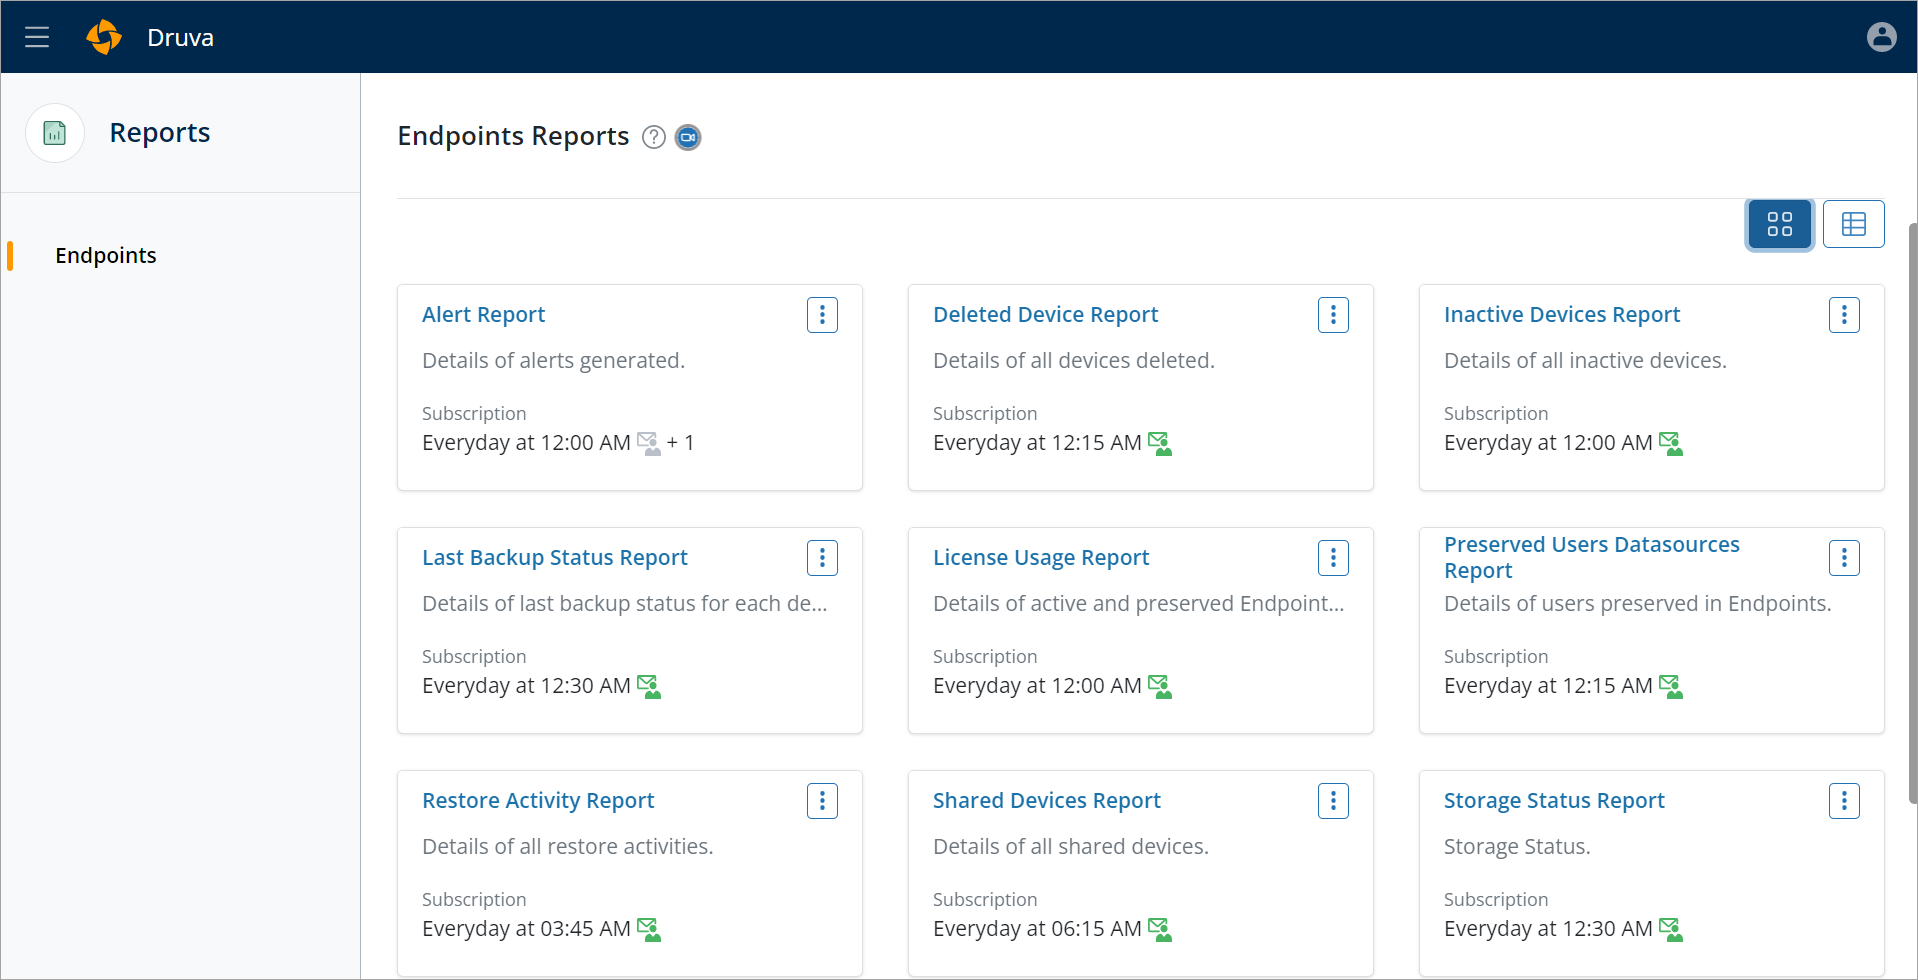
| Field | Description |
| Name | The name of the report. |
| Description | The description of the report. |
|
Email Schedule |
The details of the subscription when the report is generated and sent over an email to the subscribers. It also displays the number of subscribers of that report.
Example:
|


Note: The following list of reports is displayed depending on the workload you are protecting.
Related Actions
Here’s a quick video to get you started
How to use Reports
Note:
- The subscriptions from the Endpoints page and the Druva Cloud Platform page are independent, so if you subscribe at both places you may receive two emails unless you remove one subscription. Existing Endpoints report subscriptions from the Endpoints page continue to function and subscribers continue to receive reports in the current format.
- By default, the report data is displayed for the last 30 days for all reports (except the License Usage and Users Reports where the default period is 8 weeks/12 months). You can edit the default period if required using the Updated Time page filter.
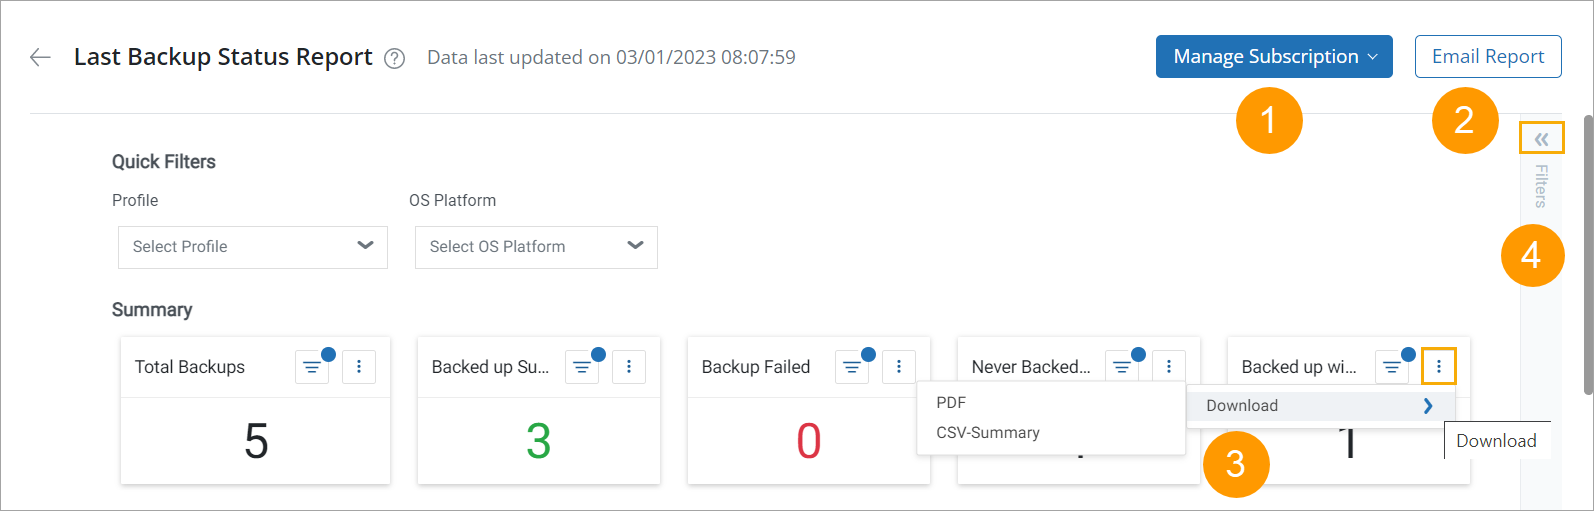
You can perform the following actions on every report page.
| Sr.no | Action | Description |
| 1 | Subscribe to report |
You can schedule and subscribe to receive reports over email as a CSV file or a PDF. A subscription can be created for other members of the organizations too.
|
| 2 | Email the report |
You can email the report in CSV or PDF format on demand to other recipients.
|
| 3 | Download widget data | You can download the widget data in CSV or PDF format. |
| 4 | Add Filters to get a report with more granular data |
Global filter: You can create a global filter, page filter, or panel filter to fetch details based on your requirements. Benefits of applying filters
|