Introduction to Druva Cloud Platform Dashboard
The Druva Cloud Platform Dashboard provides a consolidated and workload-centric view of the platform. You now get a holistic status of the health of your data protection ecosystem. The dashboard view is tailored as per your role and licensed services.
Global left navigation pane
From the global left navigation pane, you can access the following sections:
| Section | Description |
|---|---|
| 1 |
View and access all workloads and services from the All services section. The services you have licensed are indicated with a green tick. |
| 2 | Access your top 5 frequently visited pages of the Druva Console |
| 3 | Access all your licensed services and workloads. |
| 4 | Initiate platform administration tasks. |
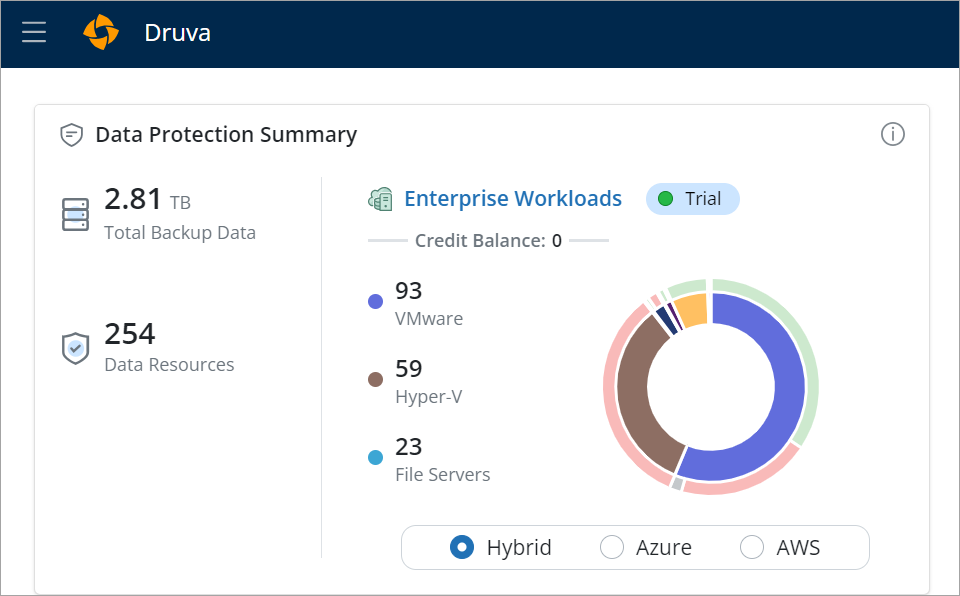
Data protection summary
The Data Protection Summary card provides an at-a-glance view of all the workloads and resources being protected, the storage and licenses/credits consumed, and the last backup status.
The Data Protection Summary card comprises the following:
1. Aggregate view
Get an aggregate view of the total backup data and resources to understand the coverage and size of your data protection environment.

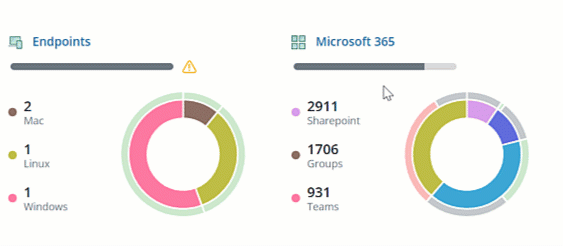
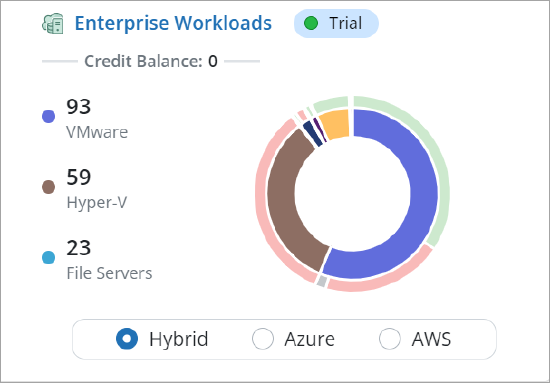
2. Workload view
The workload view provides workload-level information with individual insights into the backup data size and the number of resources protected by each data source.
When you click on a data source (inner ring) a resource view is displayed that provides information about the number of resources protected for the data source, the storage consumed, and the last backup status.
Backup data for resources is displayed based on the following states:
|
Endpoints |
User Apps: |
Org Apps: Sharepoint, Groups, Public Folders, Team, Shared Drives |
Enterprise Workloads |
|---|---|---|---|
| Resource configured for backup (enabled and disabled) | Resource configured for backup (enabled and disabled) | Resource discovered and configured for backup (enabled and disabled) | Resource configured for backup (enabled and disabled |
Note: The data is populated after the first backup is completed.
The following information is provided in the chart:
|
Chart section |
Description |
|---|---|
| Inner ring |
Displays a data source view of each workload which provides information about the backup data size and the number of resources protected by each data source. Click on the workload title to access the workload dashboard. |
| Inner ring side legends | Display the top 3 resources based on the count. |
|
Outer ring (Select the required data source in the inner ring to get a resource level view) |
Displays resource-level view of last backup status.
For example:
|
| Outer ring side legends |
Displays the total number of resources protected, the total size of backup data, and the last backup status. Click on the Last backup status number to access the additional details available in the interface of the respective workload. |
3. License consumption view
Endpoints, Microsoft 365, and Google Workspace
You can view the count of active and preserved licenses consumed. For Endpoints and SaaS Apps, you are also informed about license renewal due date 60 days before expiry.
Based on the count of active and preserved licenses, you can track and optimize monthly and daily license usage.
Enterprise Workloads
The Credit Balance on the dashboard depicts the credit utilization based on storage consumption.
Based on your credit balance, it is helpful to view the number of unutilized credits at the end of the day.
Security and compliance summary
Get a consolidated view of security and compliance. With this information, get an insight into how resilient your data protection ecosystem is.
The following cards are available:
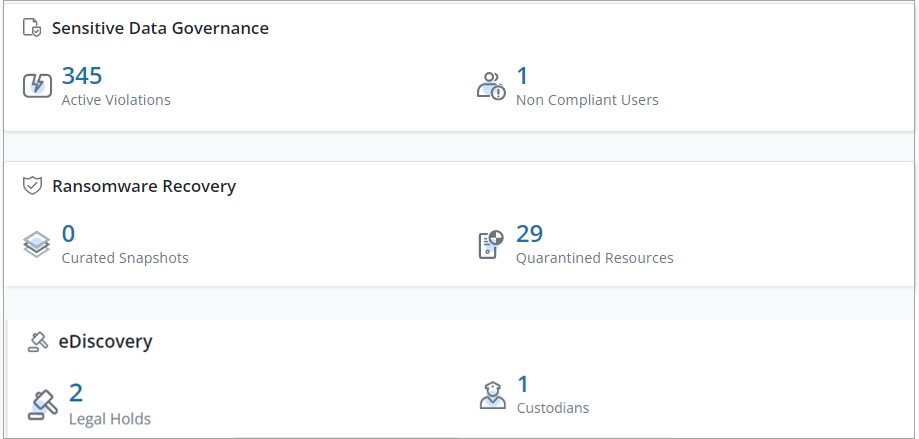
Sensitive Data Governance
View the total number of Active Violations to promptly address active violations by defensibly deleting sensitive data in a backup, source, or both.
Proactively monitor the total number of non-complaints users.
Click on the number of Active violations and Non-Compliant Users to access the Sensitive Data Governance interface.
Ransomware Recovery
View the total number of Curated Snapshots to identify unusual activity and prevent contamination from spreading within minutes of detection.
View the total number of Quarantined Resources to manually search for the impacted resource and quarantine the infected or all the snapshots.
Click on the number of Curated Snapshots or Quarantined Resources to access the Ransomware Recovery interface.
eDiscovery
View the total number of legal holds and custodians across an organization to reduce reliance on custodians and minimize the risk of spoliation.
Click on the number of legal Holds or Custodians to access the eDiscovery interface.
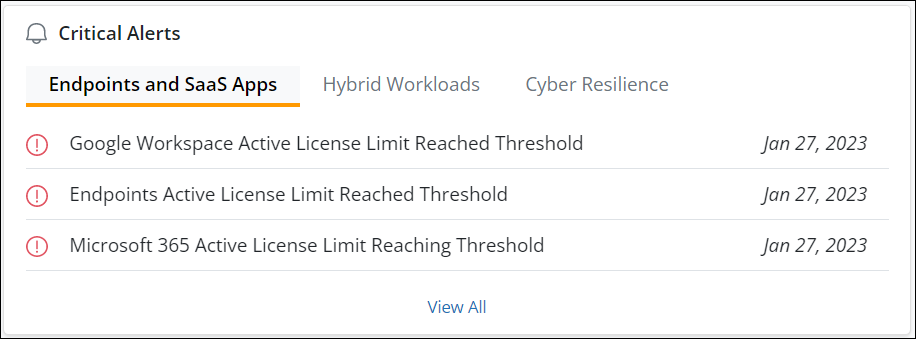
Critical alerts
Without going to the multiple workload and services page at a single glance, you will know which critical alerts you need to address on priority. The top 5 critical alerts are displayed based on recency.
Click on the View All button to view all the alerts on the respective workload or service's Alerts page.
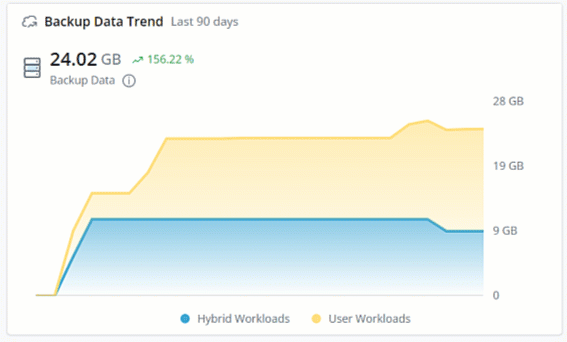
Backup data trend
You can analyze backup data growth trends for the last 90 days. Select the date range on the graph to view data for a single or selected number of days.
With this information, you can plan for your storage requirements. You can look for patterns in the data growth trends, such as whether the data growth is consistent or if there are sudden spikes or drops. If you notice any unusual patterns, it's worth investigating further to see if an underlying issue needs to be addressed.
The backup data growth trend is displayed for:
- Enterprise Workloads
- User Workloads
- Devices
- Exchange Online
- OneDrive
- Gmail
- Google Drive
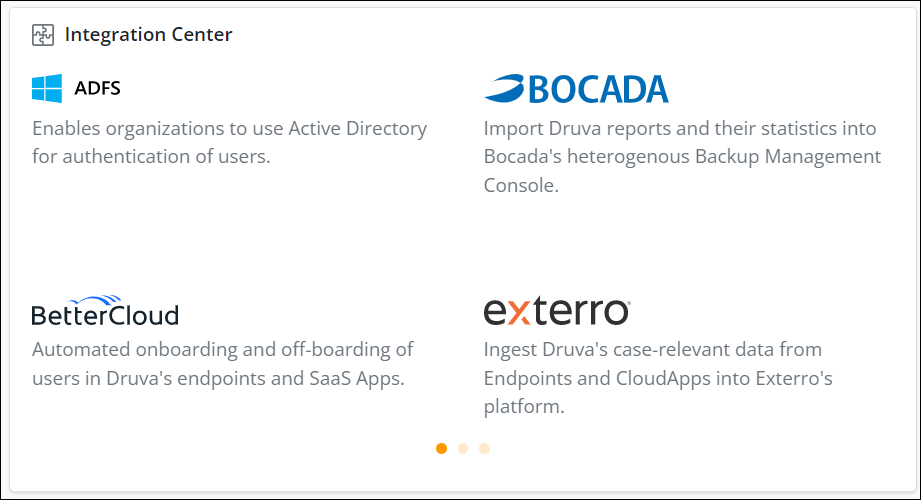
Integrations center
This card lists all the third-party applications Druva leverages.
Druva has partnered with various third-party applications to help simplify customers’ business operations. By plugging into Druva’s API-based ecosystem integrations, you can tap into new sources of data, improve existing business processes and reuse existing resources to automate business policies.
When you click on any third-party application, the All Integration page is displayed with links to more information about the third-party integration.
Currently, Druva leverages the following third-party applications:
|
Third-party application |
Purpose |
Leveraged by |
|---|---|---|
|
ADFS |
Enables organizations to use Active Directory for authentication of users. Learn More. |
Endpoints and SaaS Apps |
|
BetterCloud |
Automated onboarding and off-boarding of users in Druva's endpoints and SaaS Apps. Learn More. |
Endpoints and SaaS Apps |
|
Bocada |
Import Druva reports and their statistics into Bocada's heterogenous Backup Management Console. Learn More. |
Endpoints, SaaS Apps, and Enterprise Workloads |
|
Exterro |
Ingest Druva's case-relevant data from Endpoints and SaaS Apps into Exterro's platform. Learn More |
Endpoints and SaaS Apps |
|
Fireeye |
Strong endpoint resilience, reduced downtime and accelerated recovery from Ransomware attacks. Learn More. |
Endpoints and SaaS Apps |
|
GitHub |
Enables organizations to integrate Druva offerings into their business. Learn More. |
Endpoints, SaaS Apps, and Enterprise Workloads |
|
Okta |
Enables Single sign-on (SSO) and automatic provisioning of mobile and endpoint users into the Druva Platform. Learn More. |
Endpoints, SaaS Apps, and Enterprise Workloads |
|
Paloalto |
Enables automated and workflow-based orchestration mechanisms in case of a security incident. Learn More. |
Endpoints, SaaS Apps, and Enterprise Workloads |
|
ServiceNow |
Integrate Druva Platform incidents into ServiceNow’s centralized ticketing systems. Learn More. |
Enterprise Workloads |
|
Slack |
Configure Slack webhooks for notifications within Native Workloads. Learn More. |
Native Workloads |
|
Splunk |
Enables organizations to respond, mitigate, and recover from Ransomware threats within minutes. Learn More. |
Endpoints and SaaS Apps |
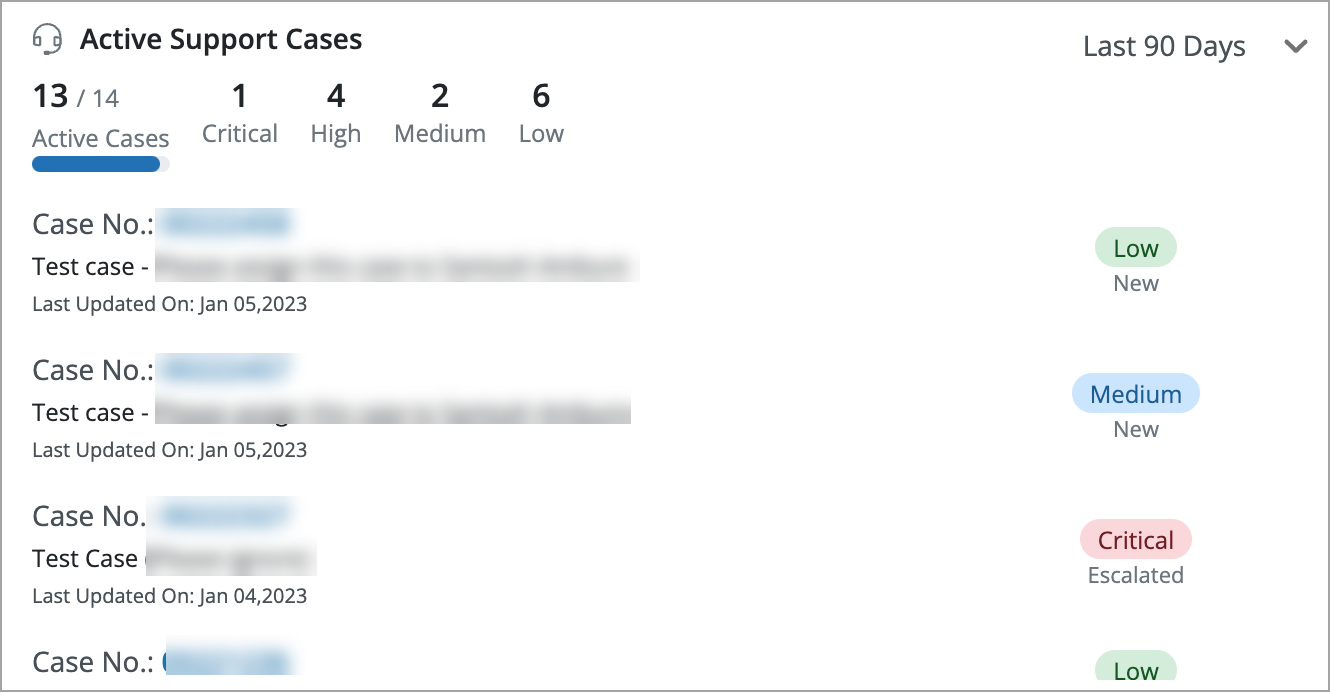
Active support cases
You can track the active support tickets based on severity.
All Druva administrators can track the status of all active support cases without logging on to the support portal. Click on the case ticket to view the support portal.
You can use the 7, 30, and 90 days filters to narrow down the active cases search. The active cases are categorized as severity-critical, high, medium, and low.
Cloud status
This card shows the region where your snapshots are stored and their health. In the below example, one location in your account is operational.
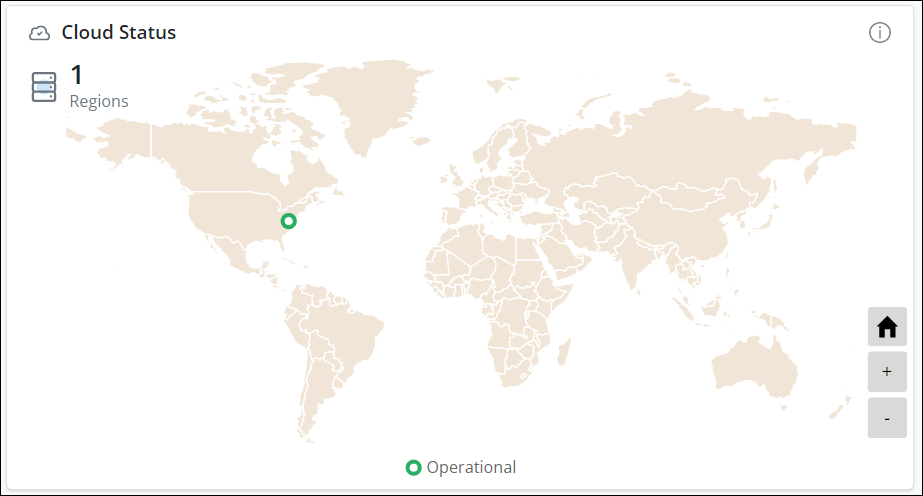
The possible states are:
|
State |
Denoted with |
Description |
|---|---|---|
|
Operational |
Green |
All Druva services are up and running. |
|
Planned Maintenance |
Blue |
Few or all regions are undergoing scheduled maintenance. Druva services may not be available for some time. |
|
Partial Service Disruption |
Orange |
Regions denoted with the orange dot are unavailable. Druva services linked to this region are not available for use until the regions are operational. |
|
Service Disruption |
Red |
All regions are unavailable and none of the Druva services are available for use until the regions are operational. When you hover on the region, you can see how much storage a service consumes in the region. |
The cloud status section shows service disruption for a region, if it is unavailable for either Endpoints and SaaS Apps, or Enterprise Workloads. It is possible that the region is unavailable for one of the products while it is available for the other service. To see if a region is available for Endpoints and SaaS Apps, or Enterprise Workloads, hover over the region and see more details about it.
For example, it is possible that a region is unavailable for Endpoints and SaaS Apps while it is available for Enterprise Workloads, and the cloud status section shows service disruption. However, if the Druva license is not attached to the account, the cloud status shows operational for that region since it is available for Endpoints and SaaS Apps.
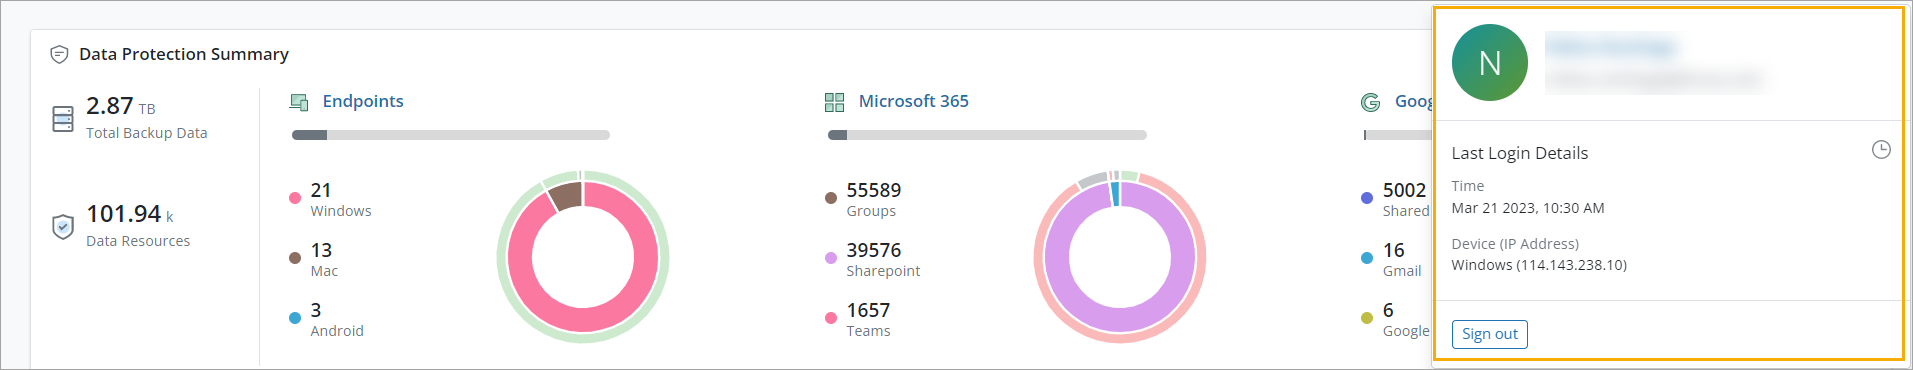
Last Login Details in the user profile
In the user profile, you can also view the last login date, time, device name, and IP address from which the login occurred.
This information gives visibility about the last login details.
Limitations
Currently, data is not displayed for Salesforce.