Security Events Dashboard
Introduction
With the employees of the organization spread across the globe, it is critical that only the authorized people in the organization have access to the relevant data that you back up with Druva. Now, if you happen to leave this to chance, you are at the risk of insider threats or ransomware, and several sleepless nights.
Druva offers Security Events, a dashboard that shows you upfront the count of all administrator login events, data access events, API requests, and unusual data activity alerts and nudges you to take remedial actions if required. This data helps you gain situational awareness about the backed-up data by gathering events from all Druva products.
You must be a Druva Cloud administrator to view the Security Events dashboard.
The Security Events dashboard displays the following:
-
The total count of administrator logins and API requests from new locations.
-
The restore and download activities performed by administrators and inSync Client users.
-
The locations from where administrators have logged into the Druva management console. The locations are displayed on a map for easy visual reference. The list of administrators with finer details and do a more detailed analysis of the login activity.
-
The locations from where administrators have made an API request with several important details.
-
The number of unusual data activity alerts generated.
-
The number of endpoints and servers that have been quarantined. You can click the count to view the list of quarantined resources.
By default, the data is displayed for the last 7 days. We give you the option to increase the period from 7 days to 30 days.
Viewing data for two different periods helps you identify if anything has gone awry in between.
Know your Security Events Dashboard
Let’s take a look at the details that you can view on the Security Events dashboard.
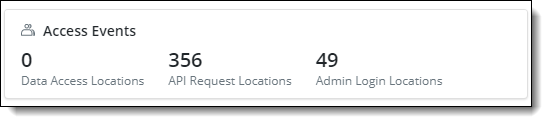
Access Events
This card shows you the sum of restore and download activities, login attempts, and API requests made from new geo-locations in the defined time period. Tracking of new locations is important because there might be data access events, login attempts, or API calls from undesired locations. You might want to delve deep into the attempts and find out more about them using Admin Audit trails and User Audit Trails.
When a Druva administrator tries to log in to the Druva Cloud Platform or the Management Console, it is considered as a login attempt, even if the login is unsuccessful. Similarly, whenever an API call is made, it is considered as an API request even the call fails. For data restore and download events, as soon as an inSync Client user or an administrator initiates the activity, it is considered as an attempt to access the data.
A new location is an IP address that was not used for logging into or for making an API request in the defined time period.
This information helps you to
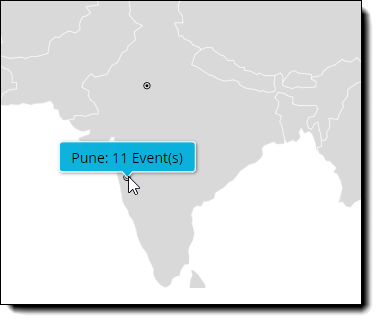
- Understand the number of new geo-locations from where administrators or users attempted to access data by logging in to the Management Console or by using APIs or using the inSync Client. You can click the country name to view the cities in that country from where the data access attempts were made. Each city is represented with a black dot. You can mouse over each city name to view the number of events generated from that city. Click the city name to view the list of events for that city.
-
Check if there has been a sudden spike for any of the events in the last 7 days as compared to the last 30 days. If yes, then you must dive deeper into the data and determine if all the events were made from authentic sources.
Data Access Events
Whenever any of the following activities are initiated, it's termed as a Data Access event:
- An administrator restores data or downloads data from:
- An inSync Client user restores or downloads data using inSync Client or inSync Web.
Support for events generated when an inSync administrator downloads Legal Hold data and when inSync administrator does bulk export is planned for future releases.
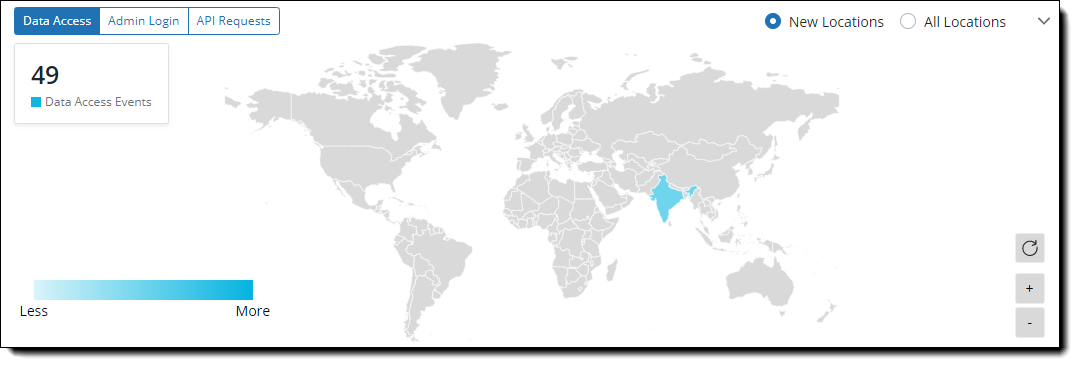
Below the map, there is a list of administrators and inSync Client users (only applies for endpoints) who triggered a data access event in the selected time frame. There can be the following types of data access:
- Admin Restore: Denotes that an administrator initiated a data restore activity.
In the case of VMware, the IP address details are not displayed for admin restore access.
- Admin Download (Only for Endpoints): Denotes that an administrator initiated a data download activity.
- User Restore (Only for Endpoints): Denotes that the inSync Client user initiated a restore.
- User Download (Only for Endpoints): Denotes that the inSync Client user initiated a download.
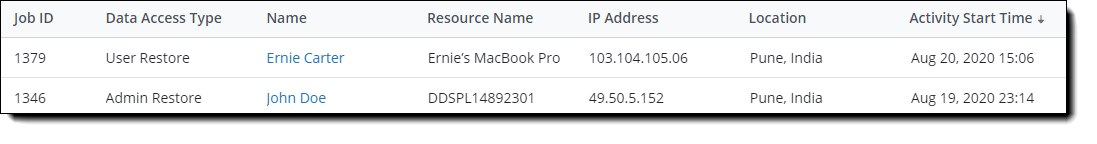
Click the name to view the details of all the events triggered by that individual in the selected time frame. The details page also displays the status of the initiated activities.
This information helps you to
- Understand who all have tried to gain access to the backed up data in the defined time period.
Actions you can take
- While viewing the activity details for a user, if you find something suspicious, you can reset the password of the user. Click the Manage User button to navigate to the User Details page and reset the password. This will prevent unauthorized people from gaining access to that user's data.
- Similarly, if you notice something suspicious about the activities of an administrator, you can reset the administrator's password. Click the Manage Administrator button to navigate to the Admin Details page and reset the password.
Admin Login Events
This card displays the count of new locations from which Druva administrators attempted to log in to the Management Console. The map shows the geo-locations of the login attempts that were tracked.
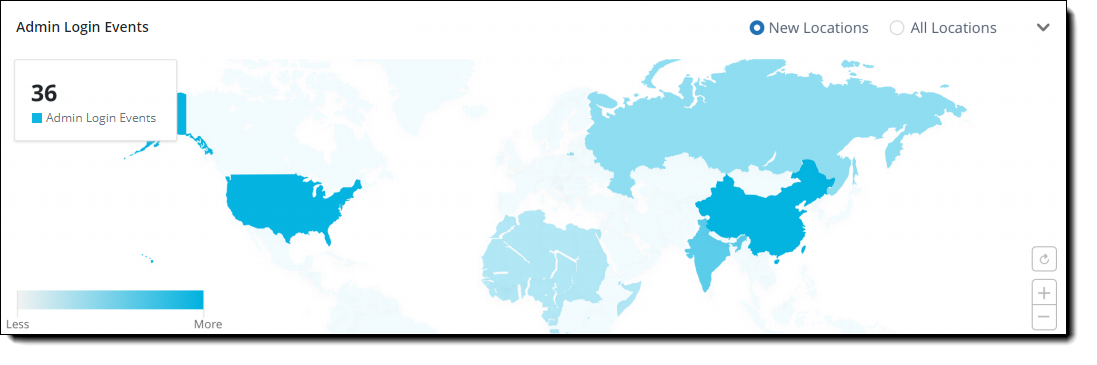
You can select All Locations to view the count of Druva administrators who attempted to log in to the console at least once.
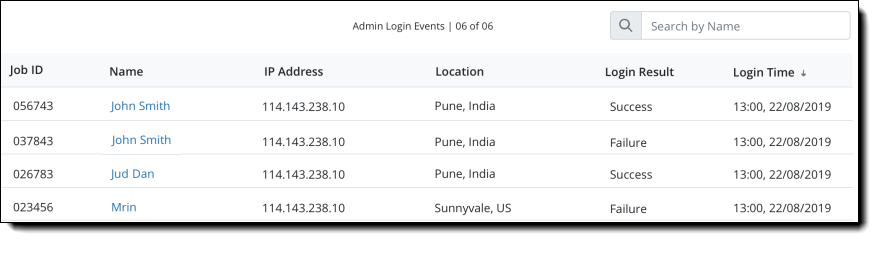
The list of administrators who attempted to log into the console is displayed below the Admin Login Events section.
This information helps you to
Understand which Druva administrators have attempted to log in to the console at least once. The list also displays the following:
- Job ID: Displays the ID generated by the system at the time when the login was attempted. You can use this ID to identify the attempt with the email alerts that you receive.
- IP address: The IP address of the device that the administrator used to log in.
- Location: The city and the country from where the administrator attempted to log in.
- Login Result: If the login succeeded or failed.
- Login Time: The timestamp of the activity.
Actions you can take
- If you find anything suspicious, click the name of the administrator and view the detailed login activity.
- If you think that the behavior is unusual, on the administrator details page, click the Reset Password button to reset the password of the administrator.
API Requests
This card displays the count of API request attempts made by Druva administrators from the new locations. The map shows the new geo-locations from which the API requests were made.
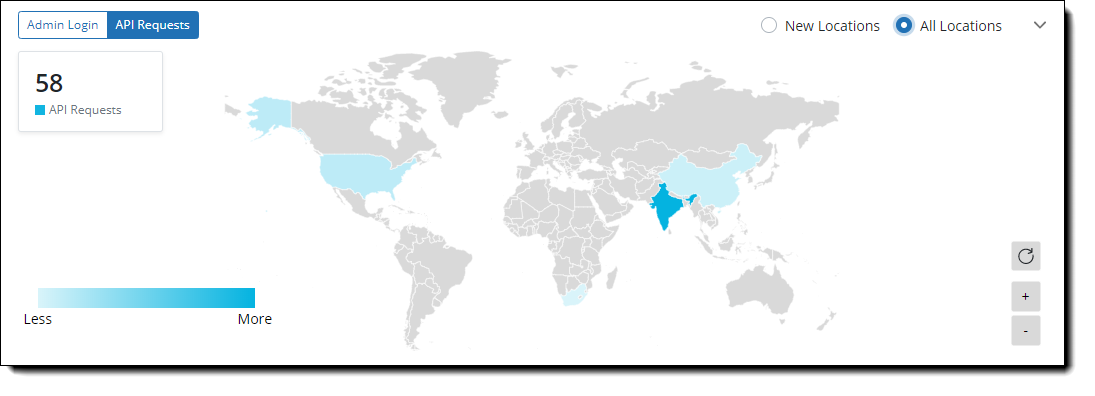
You can select All Locations to view the count of API requests that were made at least once.
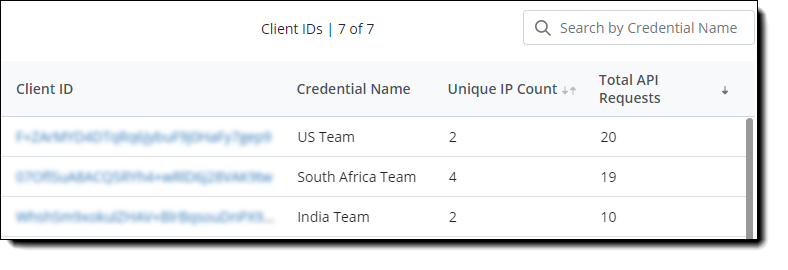
The details and the count of the API requests are displayed below the API Requests section.
This information helps you to
Understand which API requests were made at least once. The list also displays the following:
- Client ID: The ID used for that API request. Client ID and Secret Key are equivalent to user name and password. Valid credentials provide access to all the Druva APIs and in turn, access to data stored within your Druva environment.
- Credential Name: The name that was used to generate the Client ID for these API requests.
- Unique IP Count: The total number of unique IP addresses from where the API requests were made.
- Total API Requests: The total number of API requests made using the associated Client ID.
Actions you can take
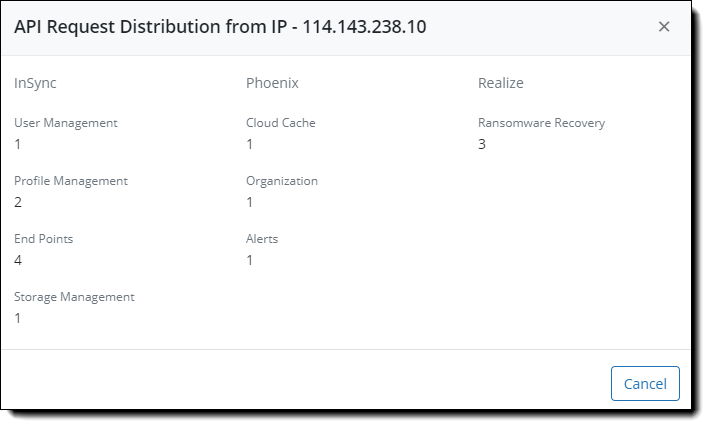
- If you find anything suspicious, click the name of the Client ID and view the detailed activity. Click any IP address to view the count of API requests made for each API group.
- If you think that the behavior is unusual, on the Client ID details page, click the Edit Credentials button to view the details of the API credentials and take necessary measures.
Unusual Data Activity (UDA)
Suspicious data modification on a resource is called Unusual Data Activity (UDA). For example, if a resource in your organization is under attack, the malicious software on the resource can start deleting the data present in the resource.
To learn more about Unusual Data Activity (UDA) and the detection mechanism that Druva uses to trigger a UDA alert, see the Unusual Data Activity topic.
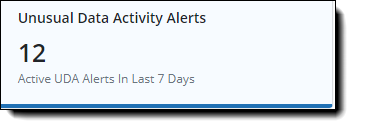
The Unusual Data Activity Alerts card displays the count of all unusual data activity alerts for the selected time range. Click the card to view the details of the alerts that are generated.
The details and the count of the UDA alerts are displayed below the unusual data activity alerts distribution section.
By default, alerts for Endpoints are displayed.
- Click File Backupsets to view the alerts for Windows/Linux File Servers and NAS resources
- Click Virtual Machines to view the alerts for Virtual Machines (VMware)
- Click Microsoft 365 to view alerts for Sharepoint and OneDrive resources.
This information helps you to
- Understand what unusual data activity caused to trigger an alert. For detailed information, see View UDA alerts.
Actions you can take
- To learn about the options on how to tackle an alert, see Take action on an alert