Overview page
It is the first page you see when you log in, and it provides information about:
- Last Updated at <date timestamp>
- Quarantined Resources
- Curated Snapshots
- Malicious File Scan
- Unusual Data Activity-Alerts Activity
- Unusual Data Activity-Service Status
The sections of the page are described below.
Last Updated at <date timestamp> UTC
Displays the most recent date and timestamp (UTC) when the data was refreshed.
Quarantined Resources
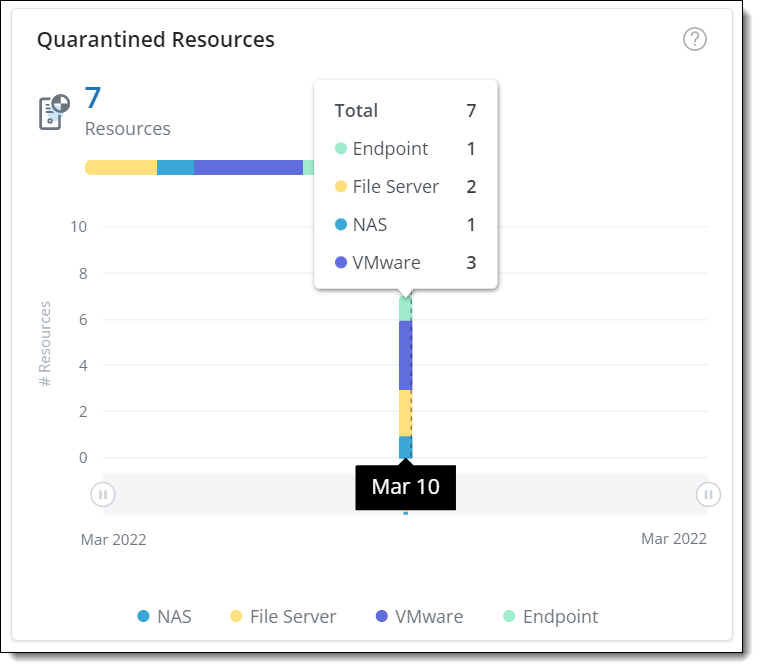
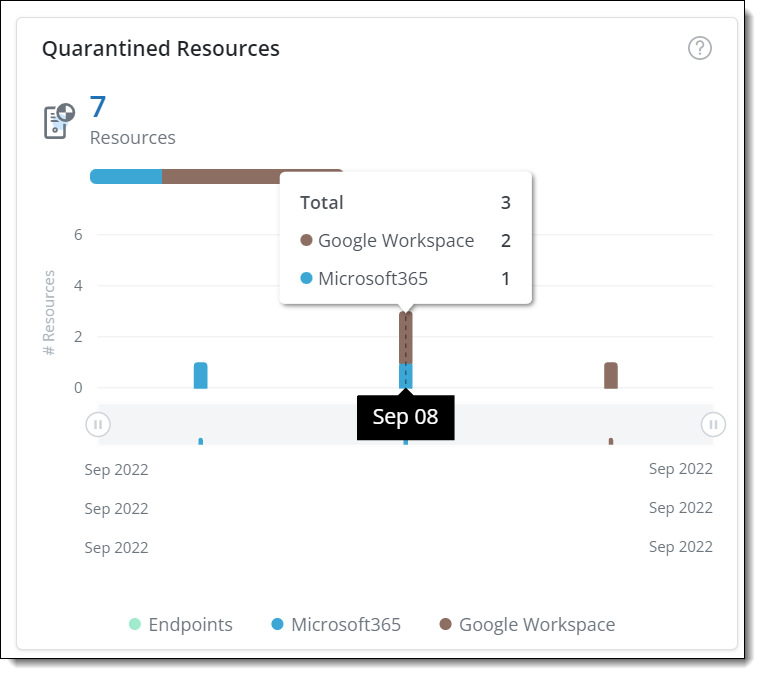
The following table describes the information in the Quarantined Resources section:
| Field | Description |
|---|---|
| Resources |
Shows the total number of active quarantined resources. The resources can be Endpoints, Microsoft 365, Google Workspace, File Servers, NAS devices, or VMware. You can view the individual count details of active and latest quarantined resources for each resource-Endpoints, Microsoft 365, Google Workspace, File Servers, NAS devices, or VMware using the graphical representation. The X-axis displays the specific date when the resource was last quarantined while the Y-axis displays the corresponding count of quarantined resources. For more information, see,
|
Curated Snapshots
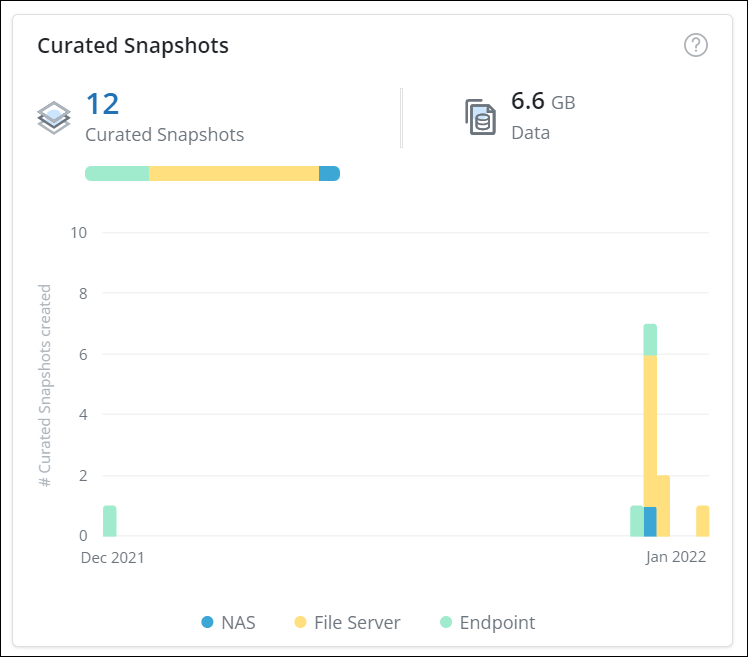
The following table describes the information in the Curated Snapshots section:
| Field | Description |
|---|---|
| Curated Snapshots | Shows the total number of active curated snapshots created for your resources. Resources can be Endpoints, File Backupsets (File Servers, or NAS devices), or Microsoft 365 (OneDrive, SharePoint). You can view the individual count details of active and latest Curated Snapshots for each resource-File Backupsets (File Servers, or NAS devices), or Microsoft 365 (OneDrive, SharePoint) using the graphical representation. The X-axis displays the specific date and time when the curated snapshot was last created while the Y-axis displays the corresponding count of curated snapshots created for your resources. For more information, see Curated Snapshots. |
| Data | Shows the total size of the data within the active curated snapshots created for your resources. For more information, see Curated Snapshots. |
Malicious File Scan
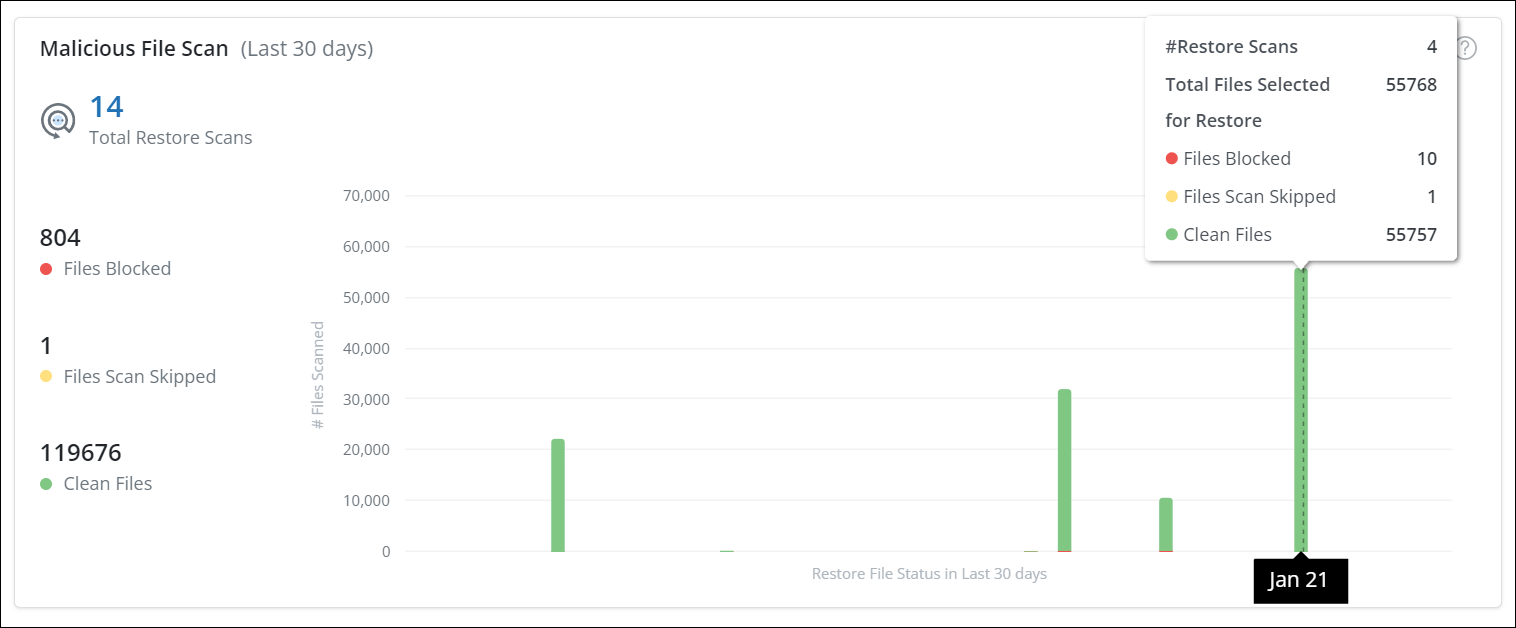
The following table describes the information in the Malicious File Scan section:
| Field | Description |
|---|---|
| Total Malicious File Scan | Shows the total number of Malicious File Scan jobs run for your resources in the past 30 days. Resources can be Endpoints, File Servers, NAS devices, or VMware. |
| Files Blocked | Shows the total number of malicious files that were blocked out of the total number of files selected for restore for your resources in the past 30 days. Resources can be Endpoints, File Servers, NAS devices, or VMware. |
| File Scan Skipped | Shows the total number of files that were skipped from the scan out of the total number of files selected for restore for your resources in the past 30 days. Resources can be Endpoints, File Servers, NAS devices, or VMware. |
| Clean Files | Shows the total number of files that were found safe out of the total number of files selected for restore for your resources in the past 30 days. Resources can be Endpoints, File Servers, NAS devices, or VMware. |
| #Files Scanned | The X-axis on the graphical representation displays the number of files scanned for your resources. Resources can be Endpoints, File Servers, NAS devices, or VMware. |
| Restore File Status in Last 30 days | The Y-axis on the graphical representation displays the status of file restores for the last 30 days for your resources. Resources can be Endpoints, File Servers, NAS devices, or VMware. Hover over the bar graph to view details. |
Unusual Data Activity-Alerts Activity
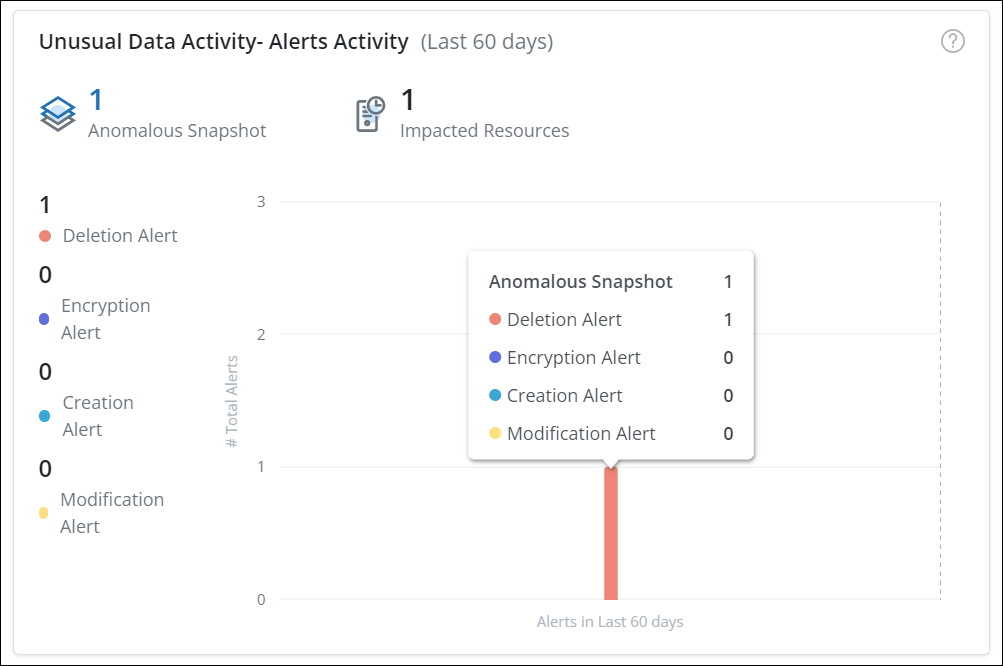
The following table describes the information in the Unusual Data Activity-Alerts Activity section for the last 60 days:
| Field | Description |
|---|---|
| Anomalous Snapshot | Shows the total number of anomalous snapshots for which Unusual Data Activity alerts were generated for your resources. Resources can be Endpoints, File Servers, NAS devices, VMware, or Microsoft 365 (SharePoint and OneDrive). For more information, see Unusual Data Activity. |
| Impacted Resources | Shows the total number of impacted resources on which unusual data activity was identified. Resources can be Endpoints, File Servers, NAS devices, VMware, or Microsoft 365 (SharePoint and OneDrive). For more information, see Unusual Data Activity. |
| Deletion Alert | Shows the total number of alerts generated for deletion of files from the snapshot. For more information, see Unusual Data Activity. |
| Encryption Alert | Shows the total number of alerts generated for encryption of files. For more information, see Unusual Data Activity. |
| Creation Alert | Shows the total number of alerts generated for the creation of too many files. For more information, see Unusual Data Activity. |
| Modification Alert | Shows the total number of alerts generated for the modification or edits of too many files. For more information, see Unusual Data Activity. |
| # Total Alerts | The X-axis on the graphical representation displays the total number of alerts generated for Unusual Data Activity for your resources. Resources can be Endpoints, File Servers, NAS devices, VMware, or Microsoft 365 (SharePoint and OneDrive). For more information, see Unusual Data Activity. |
| Alerts in Last 30 days | The Y-axis on the graphical representation displays the number of anomalous snapshots for which Unusual Data Activity alerts were generated on specific days over a span of the last 30 days for your resources. Resources can be Endpoints, File Servers, NAS devices, VMware, or Microsoft 365 (SharePoint and OneDrive). Hover over the bar graph to view details. For more information, see Unusual Data Activity. |
Unusual Data Activity-Service Status
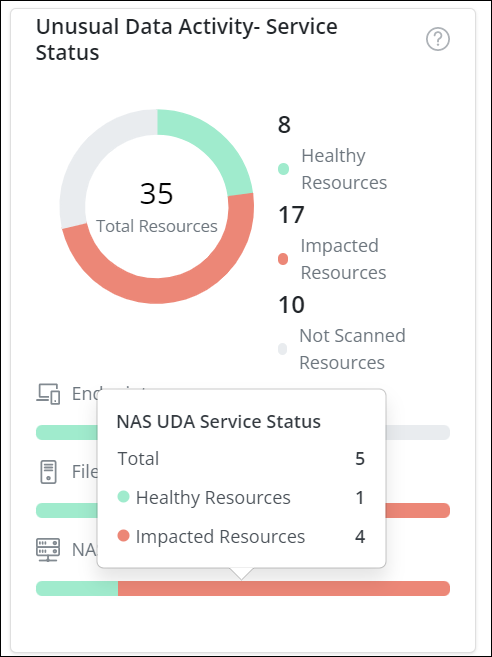
The following table describes the information in the Unusual Data Activity-Service Status section:
| Field | Description |
|---|---|
| Total Resources | Shows the total number of resources present. |
| Healthy Resources | Shows the total number of resources that were found safe out of the total number of resources for which Unusual Data Activity alerts were generated. Resources can be Endpoints, File Servers, NAS devices, VMware, or Microsoft 365 (SharePoint and OneDrive). For more information, see Unusual Data Activity. |
| Impacted Resources | Shows the total number of resources that were found infected out of the total number of resources for which Unusual Data Activity alerts were generated. Resources can be Endpoints, File Servers, NAS devices, VMware, or Microsoft 365 (SharePoint and OneDrive). For more information, see Unusual Data Activity. |
| Not Scanned Resources | Shows the total number of resources that were not scanned for Unusual Data Activity. Resources can be Endpoints, File Servers, NAS devices, VMware, or Microsoft 365 (SharePoint and OneDrive). For more information, see Unusual Data Activity. |
|
Details for each resource for Unusual Data Activity (UDA)
|
Shows the UDA service status for each resource. Hover over the graph to view the details. For more information, see Unusual Data Activity. |
If you encounter UDA errors for VMware resources, see VMware errors for UDA to resolve them.